A while back, I came across a fascinating paper from 2007 by Gurven and Kaplan on longevity among hunter-gatherers that helped me understand aspects of what life was (and is) like outside of modernity. My interest is both a matter of pure curiosity, and to gain perspective on how desperate life feels—or doesn’t—to members of pre-agricultural (ecological) cultures.
I wrote last year about the perceived perils of early human life in Desperate Odds, in the context that to us members of modernity, having never been weened from the teat of agricultural output, it seems like life without agriculture (and supermarkets) would be a virtual death sentence. Add to this a perceived vulnerability to predation from lions and tigers and bears (oh my!), and the mental image that emerges—as depicted by Daniel Quinn in Ishmael—is of a stressed and starving hunter following the tracks of elusive prey as twilight darkens, while a predator is close on his trail, audibly breathing. It feels like a knife edge of survival: everything has to go just right, but teeters on all going horribly wrong.
The core argument from the Desperate Odds post was that surviving to reproductive age was obviously common, or our species would wink out. This simple fact makes daily survival a near-guarantee—enough so that fear of death is not top-of-mind most of the time, allowing most brain cycles to go toward less-troubled, routine activities.
It was either in preparing that post or in connection with A Lifetime Ago that I ran across the aforementioned paper. In this post, I dig in to see what insights can be gained from survival models for various human cultures.
The Attention-Grabber
Let’s start with the plot that caught my eye and drew me in, which is Figure 3 in the paper.

Let’s see if it draws you in as well.
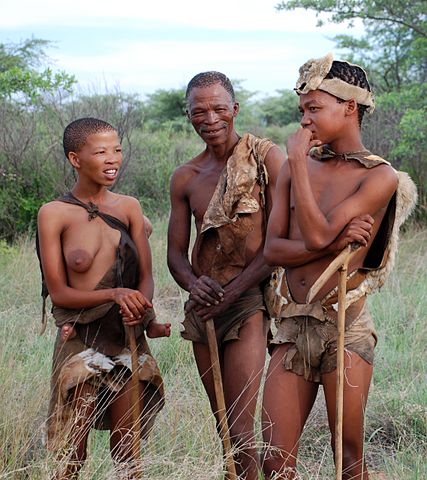
This plot shows life expectancy (remaining years) as a function of age for different non-agricultural groups, including some guesswork as to pre-historical human longevity, a point-making 18th Century Sweden—invisibly buried among the others—and even wild chimpanzees to make it a real party.
Life expectancy at birth is the y-axis intercept (left edge) for each curve, quantified as e0 in the legend. Early-year mortality is visible via the initial rise in life expectancy over the first few years.
To gain familiarity with the graph, notice that the cluster of curves indicates a y-value around 25 at 40 years of age, meaning that a 40-year-old can expect (50/50 chance) to live another 25 years, to age 65. Another way to put it is that in steady-state, the population of 65-year-olds is approximately half that of 40-year-olds. Once at 5-years-old, one can expect to live to about 50–55 for most of these curves, and by age 20 it’s 55–60. These are for present-day hunter-gatherers without access to modern medicine and food, as the paper describes:
All groups in our ethnographic sample of hunter-gatherers have had minimal or no exposure to modern medicine, and minimal or no inclusion of products of horticulture or market-derived foods in their diet.
Digging Deeper
Okay, this plot struck me as a rich resource for learning more, so I dove in. I learned that an underlying model used in the analysis is called a Siler model (after a 1983 paper) that describes mortality rates via three components (early childhood mortality, exponentially decaying; constant low-level risk; exponentially increasing mortality with age)—represented as Equation 1 in the paper, an example plot of which appears below (red curve). From this, one can derive the age distribution of the population, which is Equation 2 (with mistake: b1x should be −b1x). Given the age distribution (essentially a population pyramid), one can extract life expectancy by asking: at what age is the population of the age in question cut in half?
Noting that the curve for the !Kung bush-folk is buried within the raft of present-day hunter-gatherer curves, I use it as a reasonable representative. Pulling the Siler parameters listed in Table 2 of the paper, I create the following plots of survival, population distribution, and life expectancy for the !Kung.


Note that the last plot is qualitatively similar to the curves from Figure 3 in the paper (above). In the population plot, the total helps contextualize the population. In this case, it means that there are 1.0 infants (0–1 year old) per 32.8 people. A group of 100 people would therefore—statistically—have three infants and two three-year-olds (where the graph is near the 2/3 mark).
Three Cases
The main group I am interested in understanding is present-day hunter-gatherers living ecological lives without much contamination from modernity (as noted above). This group therefore represents a (now rare) modality found at various places in the world today, for which reliable data exists—as shown in the collection of generally-similar curves from the paper. I will use the !Kung case to represent this modality.
But I am also curious about the prehistoric group, even though the model used in the paper is questionable. The curve in the figure is considerably different from the present-day hunter-gatherer groups—raising an eyebrow—and not drastically dissimilar from the wild chimpanzee curve. Color me skeptical, but I make the comparison anyway. Note that the paper has important caveats about the veracity of the prehistoric model: it might not be as brutish as depicted. Later, I give a quantitative argument that if the prehistoric curve were any lower, humans would flirt with species extinction, given reproductive timelines.
While the Siler parameters are not present in the paper for the prehistoric example, I was able to reconstruct a “reasonable” set by matching to the life expectancy outcome in the plot. Note that any effort at exactness would be pedantically silly, in this context. Here are the resulting plots.


The third group I use for comparison is the World of 2020 (global average), as characterized by the 2022 United Nations World Population Prospects effort. In particular, the WPP provides numbers for infant mortality rate (2.8% loss by age 1), global life expectancy at birth, at 15 years, at 65 years, and at 80 years. These were sufficient to make a decent match via Siler parameters, the associated plots appearing below.


The following table captures the Siler parameters used in this work, only the first of which comes explicitly from the motivating paper.
| Group | a1 | b1 | a2 | a3 | b3 |
|---|---|---|---|---|---|
| !Kung | 0.340 | 0.943 | 0.010 | 3.31E-04 | 0.077 |
| Prehistoric | 0.125 | 0.35 | 0.002 | 8.7E-03 | 0.053 |
| World 2020 | 0.04 | 0.90 | 0.001 | 2.3E-04 | 0.070 |
I don’t particularly like the prehistoric parameters, as they imply a lower infant mortality and constant-risk than for the !Kung. But don’t blame me: blame the plot I matched (whose prehistoric curve has a smaller step up to the peak from age zero than does the !Kung !kurve). As for constant risk, we’ll see later that the other parameters work to “cover” this, resulting in an overall higher mid-life risk than for the !Kung—so I’m less concerned about that parameter. In any case, it is not necessary to take any of this literally in order to still gain insights and illustrate some broad patterns.
Key Questions
What do I want to extract from these models to help guide my thinking?
I’d want some comparative stats on likelihood of survival to particular ages. I’d like to understand something about life expectancy. I’d like to put daily risk of death in context. I’d like to know who the oldest person likely is in your band, or on the planet. What is the modal death age, beyond early life? In other words, when are you “expected” to die because your body gives out? I’d also like to know what total fertility rate (TFR) would hold the population steady for each survival model.
Survival Rates
Let’s get right to it. First, survival odds at birth, in percent:
| Group | To Age 1 | To Age 5 | To Age 15 | To Age 65 |
|---|---|---|---|---|
| !Kung | 79 | 66 | 59 | 19 |
| Prehistoric | 89 | 70 | 56 | 0.4 |
| World 2020 | 97 | 95 | 94 | 66 |
Again, I don’t take the infant mortality result literally for the prehistoric group (being better than for the !Kung), but that’s what the plot in the paper would produce if taken at face value. In all cases, most newborns make it to reproductive age, even for the just-surviving prehistoric distribution.
Life Expectancy
How about life expectancy as a function of age, expressed as full life term rather than years remaining?
| Group | At birth | At Age 1 | At Age 5 | At Age 15 | At Age 65 |
|---|---|---|---|---|---|
| !Kung | 29 | 44 | 52 | 55 | 74 |
| Prehistoric | 20 | 24 | 30 | 34 | 67 |
| World 2020 | 74 | 75 | 75 | 75 | 82 |
By the time one reaches reproductive age among the !Kung, grand-parenthood can be expected, living into the mid-fifties. In the prehistoric case, once reaching reproductive age chances are pretty strong for surviving through the reproductive years. Note that reaching 65 in the prehistoric case is uncommon (0.4% chance, as per previous table), but once there the expectation is a couple more years of life. For the world today, mortality is so low until later in life that the needle is essentially stuck at 75 throughout the childhood years. If curious about other ages, these results can be pulled off the life expectancy graphs above (green), by adding age to years remaining.
Mortal Peril?
How dangerous is daily life in the three groups? We express this as annual chance of survival, in percent, at the peak age (age with lowest chance of copping it).
| Group | Survival Chance | Peak Age | 1 in ? Odds |
|---|---|---|---|
| !Kung | 98.9 | 10 | 34,000 |
| Prehistoric | 98.0 | 11 | 18,000 |
| World 2020 | 99.9 | 8 | 250,000 |
All these are pretty darned high, but we now see how even the very low a2 value used in the prehistoric model does not translate to a free pass—the balance of the model appropriately yielding the lowest annual survival chance. In all cases, the safest time to be alive is roughly at age 10. The “odds” column is the daily chance of coming to life’s end at the golden age. In the worst case, it’s one chance in 18,000 (0.0056%). I would put forth that odds this low translate into little daily concern for death. You just go about the business you know well. Sure, you’re careful and alert, but it’s not a life of knife-edge terror—as conveyed in Quinn’s characterization of typical attitudes—and I think that’s hugely important! Don’t let fear of what we don’t personally know incorrectly color what the actual experience is like. We ought to be honest and admit that we know almost nothing about it.
Elders
How old is the oldest person in your group likely to be? How much longer might that person expect to live? I use two different group sizes in this case: 150 and 1 million. The former represents a typical moderately-large clan size, deliberately chosen to align with Dunbar’s number. The second group size tries to get at prehistoric human population, so that the age represents the oldest person on Earth, given a million people.
| Group | In 150 | Live To | In 1M | Live To |
|---|---|---|---|---|
| !Kung | 82 | 85 | 100 | 101 |
| Prehistoric | 59 | 62 | 79 | 80 |
| World 2020 | 96 | 99 | 115 | 116 |
An octogenarian is not unusual among the !Kung, and if the world were populated by a million such people, it would likely contain a 100-year-old. The table suggests that the world has hosted 80-year-old humans for quite some time (relevant to the Lifetime Ago post). Also interesting is that the oldest person in a group of 150 people is expected to live another 3 years for each of the disparate groups, while out of a million people it’s down to a year (a more extreme outlier).
Incidentally, to arrive at these numbers, I ask: at what age is the cumulative population beyond that age down to half-a-person. You’ve then got a 50/50 chance of encountering a live person at that age within the group.
Seven Generations
I’ll take a brief detour from the statistical tables to point out that knowing grandparents was commonplace throughout human existence, and even great-grandparents were not rare. A person living to old age would therefore have direct personal knowledge of three generations prior, their own generation, and three generations following (their own great-grandchildren). That’s seven generations. We hear about various Indigenous cultures practicing “seventh generation” consideration, and I wonder if the origin of that number is based on direct personal knowledge. An elder has direct access to the experiences and stories of individuals along such a span of lifetimes.
Modal Death
What is the most popular age for dying, beyond childhood? This is a different question than life expectancy. This is the age at which the population pyramid is tapering most steeply: where the largest attrition rate within the population occurs as failing physiology begins to dominate.
| Group | Modal Age |
|---|---|
| !Kung | 66 |
| Prehistoric | 32 |
| World 2020 | 81 |
The !Kung result is commensurate with the same investigation in the paper, which concludes that people appear to be built to last about 7 decades, when conditions allow. Modern health care has extended that by about 15 years, but not really night-and-day different: a 20% change, for something like (at least) 1000% more per-capita resource use and extinction-level ecological destruction: a very steep price.
Meanwhile, note that the ultimate chance of death is exactly the same (100%) in all three modalities.
Fertility
Finally, what total fertility rate (TFR) would support a steady population given the various survival models? While the result is not very sensitive to the choice of age-specific distribution of reproducing women, I adopted a simple model that ramps up linearly from ages 12 to 21, hangs steady until 31, then ramps back down toward zero at age 41. But again, the total is far more significant than how it gets spread among ages (i.e., hard to get changes greater than a few-percent via realistic alterations to the age-specific distribution).
| Group | TFR |
|---|---|
| !Kung | 4.0 |
| Prehistoric | 5.1 |
| World 2020 | 2.3 |
The theoretical TFR for “replacement” in the complete absence of mortality through reproductive age would be 2.07 to account for the fact that male babies outnumber females by the ratio 1.07:1. We often hear that replacement is 2.1, which accounts for the male/female asymmetry and a smidge of mortality—appropriate for affluent countries. But the actual number for the world as it is right now, given its survival rates, is 2.26—with regional variation of course.
In any case, if only half of babies survive to reproductive age, the TFR needs to roughly double from today’s replacement value into the 4–5 ballpark in order to hold population steady—as the tables reflect. To me, this implies a lower-bound life expectancy at birth of about 20 years (meaning half make it to 20), as it takes until about that age to have enough children to just hold population steady. Thus, the prehistoric curve in the paper seems to be close to the worst-case lower bound for the merest survival of the human species. Some periods and locations were probably like this, but other places and times would have been less difficult.
Another hint along these lines is that the frontal cortex of the brain (the closest we get to wisdom) has not finished developing until the late twenties. Why would evolutionary processes bother if humans did not routinely achieve such ages?
Reflections
How one looks at these tables depends on mindset. If it’s a matter of which one looks peachiest without applying broader considerations, well no doubt the world of 2020 offers the longest lives, lowest infant mortality, etc. If only it were a menu (subject of last post). But, as I have stressed in other places, modernity is a fleeting apparition whose self-termination is an inevitable consequence of unsustainable, non-ecological living.
The question for me then becomes: is a different lifestyle that bears some similarity to past ways tolerable? I’m not saying that I know we will identically replicate hunter-gatherer styles in the coming millennia, although I would be unjustified in ruling that out. After all, modernity will leave a mark. We’ve learned some things that will stick. In that sense, the !Kung and other present-day hunter-gatherers might be more representative of survival statistics in an age when we have greater understanding of hygiene, disease transmission, the importance of clean water, etc. Some of those gains will not be easily lost.
So, could I tolerate a world in which a 10-year-old has a 1/34,000 (0.003%) chance of dying on any given day, where the oldest person in my clan is in her 80’s, and where I’m likely to live to 60 once into adulthood? Sure: seems less than harrowing. At age 54, I can reflect that the gift of life I have already experienced has been satisfying: i need not be greedy. If the foregoing scenario means halting the sixth mass extinction and setting up for a long tenure of ecological living for humans on this planet, the price seems fair to me (and who am I to protest, in any case, in defiance reality?). The last group on each of the “menus” (tables) above represents a false and fleeting “choice” that carries the price of colossal failure, mass extinction, and self-termination—souring the appeal.
New Feature: Subscribe to receive e-mail notices of new posts (info absolutely not shared!). But note that it may be some days before I get the e-mail server properly configured—so please be patient and assume you’ll get notifications eventually.
Views: 11491
This is excellent, Tom! I've been working on a future-history piece that imagines a year-in-the-life of a hunter/gatherer band. My research has come up with much similar indications about lifespan, mortality, TFR, etc. Your analysis, coming from data, confirms what I've been thinking. Since I live near the Meadowcroft Rockshelter, which humans have been frequenting for at least 19,000 years, my fictional band of h/g folks will use it as their overwinter site, and their foraging in the warmer months will center around the several counties nearby. Right now those counties have a population of about 725,000 spread over 8,500 sq, km. In two or three centuries, I'm thinking that the area will likely still be forested, but warmer and wetter, with more seasonal variability, resembling the climate of northern Virginia or the Carolinas. Given this relatively friendly climate, I'm thinking that it could support about one h/g per sq. km., for a total of 8,500 to 9,000, broken up into about 180-200 bands of 50. I'm going to do some hiking around this fall and try to imagine what life might be like and plot a likely foraging path between the Ohio and Monongahela Rivers. I roamed all over the area when I was kid, and unless it becomes completely deforested, it should be, dare I say, almost idyllic! Like you say in this essay, I wouldn't expect my fictional tribe to be fearing for their lives!
The BBC ran a story recently about the Tsimane, who feature in the first graph:
https://www.bbc.co.uk/news/articles/ceq55l2gdxxo
To summarise: a combination of high child mortality, extreme levels of physical activity, and constant infection by diseases and parasites combine to produce almost superhuman OAPs.
The overall life expectancy is lower but the quality of life in old age is better, notwithstanding the parasites 🙂
Around 1957. I was nine and heard in the news that the life expectancy of Indians was twenty-one. That meant I already lived almost half my life. My dad noticed I was sad and I told him the reason. He pointed at my grand father who was seventy-six. He was the survivor among four siblings – one died at birth, another before the first birthday and the third around four. He had no contact with English medicine.
"Find the average of life expectancy at birth." My dad loved to give me math problems.
"Twenty-one."
"See. You made it past the critical stage. You will reach eighty, as long as you do not mingle with bad people."
Popular media confused between life expectancy at birth and life span, and made fun of pre-modern days when everyone died in their teens.
These results seem to match Herodotus, “ limit of life for a man I lay down at seventy years”. It would also appear that pre modern city life with it’s crowded and dirty conditions increased child mortality considerably
@Tmurphy
Interesting stuff.
Is it possible to extrapolate future population sizes?
If, for example, the TFR starts to creep up as modernity unwinds (and mortality rates before sexual maturity start to rise) and the FR is, say, 1.7 (UK at present) what does the population decline look like?
How do the population predictions from your previous posts, start to differ? (Accelerated decline)
I guess, predicting how the TFR relationship to declining modernity might be difficult to model.
While i sometimes indulge in romanticizing the hunter-gatherer life-style, it's going to be difficult to revert to that — without vast de-population, first.
In the past couple decades, we've extirpated some 85% of non-domesticated animals. What are the neo-hunter-gatherers supposed to hunt?
I guess that, depending on how the crash happens, the survivors may be able to hunt feral domestic animals.
Maybe they'll just be gatherers.
Let's say the food system crashed tomorrow, along with global supply chains and energy systems. It seems most likely that:
The first year, 8.5 billion humans would "hunt" all the livestock on the planet, and eat them all.
The second year, 8.5 billion humans would "hunt" all the remaining edible wildlife, and eat them all.
The third year, most of the 8.5 billion humans would starve.
There's approximately no chance that the food system will crash instantly, from 100 to 0, the way you describe. Population may already be headed downwards, and future problems in food production would speed up that process, in ways that could certainly be very ugly, but still very very far from 8.5 billion humans starving at once.
Tom has clarified multiple times that when he speculates on a return to a hunter gatherer lifestyle is thinking about centuries. Obviously if it does happen that way, by that point the population would be much lower.
Totally agree, it was just a thought experiment!
@Tmurphy
Do you have any data on causes of death for the
!Hung at different ages?
What's the main cause of death at age 3 for example.
I'm guessing predation isn't a major cause of death.
Be interesting to know what modern medicines are the most effective at preventing death.
I do not have data on this, although I strongly suspect you are correct about predation, unless one considers microbes to be the predators (justifiably).
I wonder if pre-historic hunter-gatherers weren't blighted by predation too much either?
I'm guessing they would have been pretty adept at seeing off potential predators.
Regarding the !Kung, it would be interesting to know what the causes of death are.
I guess, birth complications would have been the first hurdle for both mother and child. (unless miscarriage/still born are covered in the figures).
(Also be interesting to know if the risk of death for the mother whilst giving birth, decreases after the first child? Anecdotally, it seems, for most of the women I know, the first birth is the most protracted/difficult)
After birth, what the next big killer for 0-6 months?
Is it the same as for a 3 year old or do the risks change?
Like you say, I'm guessing microbes are the big players? But why? Why do some kids with the same parents succumb and others don't?
But then I'm thinking, if pre-historic hunter-gatherers had access to modern medicines to combat those microbial threats, then the biggest killer would have been starvation, as the ecosystem couldn't support an increase in population.
Unless people expanded out of their environment?
Maybe human expansion is the necessary result of being "too successful" at not dying.
perhaps. It's not impossible though for a population to stabilize at a level of child-making compatible with lower mortality. We are in fact below that level right now in the wealthiest countries with the highest longevity/lower mortality.
Chapter 7 ,"Group size and Demography" of "The Lifeways of Hunter-Gatherers" by Robert L. Kelly has sections on Reproduction and cultural controls, including infanticide, plus a section on Infant and Juvenile Mortality.
From the last-mentioned section :
An important cause of childhood death in many forager societies are
infectious and parasitic diseases, (lists diseases)….
Among the Dobe Ju/'hoansi,disease, especially TB and malaria,account for 85% of childhood deaths; degenerative disease (e.g. cardiovascular disease) accounted for only 4% and violence for 8%.
Accidents are responsible for only 2% of Ache infant (0-3 years) deaths but 23% of deaths of 0 to 14 year olds.
@David H
Thanks for that.
More food for thought.
If infanticide is/was part of the mix, then a communities relationship to childhood deaths, would be very different to ours.
One way or another, some kids have to die. How a society/community "spins" that is interesting.
We, in modernity, try and preserve every life.
Exponentials work with decline as well as growth. Here is a bit of math I did.
If we kept a fertility rate of 1.5 (assuming mortality doesn't increase), within 20 generations we would return to our pre-agricultural population size.
8,000,000,000 * ((1.5/2.1) ^ 20) = 9,561,571
@Stellarwind72
As modernity starts to unravel, I can only really see the fertility rated dropping further. As people become poorer, they are less inclined to have kids.
Unless a lack of access to contraception kicks in.
But then again, that could be counterbalance by an increase in mortality due to a lack of healthcare.
I found this film on population quite interesting.
https://youtu.be/A6s8QlIGanA?si=Vr-l5XdUDpPyVsSD
"As people become poorer, they are less inclined to have kids."
This doesn't seem to be true empirically, even accounting for access to contraception vs. the lack thereof.
@PGP
The film link above suggests that pretty much everywhere other than Sub Saharan Africa is below the TFR.
It's not that people are having fewer kids. It's that more people are having NO kids.
Why??
Well it's complicated but for Japan and South Korea, it seems like the trends started with economic downturns.
With economic downturns just round the corner for most people, the trend might expand???
Other factors are people waiting too late. Pursuing careers and enjoying all the benefits of modernity rather than bringing up kids.
Government enticements have failed to change the trend.
Japan and South Korea, and for that matter the US and Europe, which all have below-replacement reproduction rates now, may be struggling economically in some relative sense, but even at their worst struggling are still the most resource-rich societies humanity has even known. And within countries, it is often (although not always) the case that the poorest, or least wealthy, people have more kids on average. It is probably true that the ever quickening grind of a modern economy contributes to lower fertility (no much time or energy to have kids if you have to work 60+ hours a week), but the problem is not poverty in the sense of lack of resources.
We need to be careful in evaluating the economic success of an individual country within a global market. Japan, for instance, supplies an enormous amount of high-tech products to a growing world population, so that their shrinking domestic population is masked, in economic terms. The shell game ends when most of the affluent countries are in decline. In other words, in the initial phases, early decliners can still ride the growth wave external to their country through international trade. A reckoning accompanies a more global phenomenon: nowhere to "hide" anymore.
And, as their working age populations shrink, Japan and South Korea may not be able to keep up production of those high-tech products.
One of my favorite books that argues that hunter gathers have it better than us is "Civilized to Death"! Must Read! Thanks for another great post!
@PGP
I get what you're saying about relative prosperity.
The people of Japan aren't poor in relation to history or other parts of the world, but The Birth Gap film (linked above) in part, looks at why Japan's population is in decline.
The decline started at the time of the "oil shocks" of 1970s and hasn't recovered since.
The hypothesis being that with economic uncertainty, people put off having kids. (But it's not the only reason for the drop in birth rates)
As the rising Energy Costs of Energy eventually flip the worlds economies into degrowth, I'm just pondering if this will accelerate the drop in birth rates around the world? As people try and maintain there existing "standard of living" with diminishing incomes, having kids is "deferred" until it's too late.
After all, as I've experienced, if you want to save money, don't have kids!!!!!!😲🙂
Birth rates around most of the world, not just "The "West", are below TFR.
The only places with above TFR in the world, are in sub Saharan Africa. It's a global phenomenon.
I don't know if poorer people in Japan are having more kids than richer people?🤷. Be interesting to know the socioeconomic breakdown of birth rates there.
I don't think we disagree on the underlying phenomenon, what I am objecting to is simply conflating insecurity and uncertainty (and the general grind of a modern economy, even when you succeed in it) with poverty.
Case in point, sub-Saharan Africa is amongst the poorest parts of the world, but it's also where people are having the most children as you say. And the reason may be the same for both phenomena, it is amongst the parts of the world least "advanced" in a modern economy.
@PGP
I haven't mentioned the word "poverty" anywhere in my comments.
When I say "poorer" it's all relative.
Modernity/prosperity has allowed (some) people to have more choices/freedom in their lives. Especially women, who can choose how many (if any) kids to have and when.
Having kids has become a discretionary choice (up until the point that you have them) in a way that paying taxes, rents, mortgages are not.
As we all get relatively poorer due to decreasing energy and the unsertanties that this will bring, I can see people deciding that kids are a "luxury" that people can not afford.