
Image by Peggy und Marco Lachmann-Anke from Pixabay
Demonstrating that growth can’t continue on a finite planet has been a favorite sport of mine in the past (e.g., here, here, and here). But it’s child’s play, really: not a difficult accomplishment. Still, as blatantly obvious as it is, a surprising number of people are surprised to hear that growth can’t last. I guess that’s what happens when an entire system is predicated on growth’s continuance. Exposing the foundation to be shaky can come as seismic news.
But let’s say that we (collectively) were able to accept that growth is a no-go for the future. Fine. Let’s just stay here, then, shall we? Maybe we fashion a steady-state economy that continues to support the present scale of the human enterprise (perhaps redistributed for better equity) but without those nasty ills of growth.
In this post, I do the simple “math” of presenting graphs (Do the Graph?) to try and ascertain whether the ills stem primarily from growth, or primarily from scale.
Death by Hockey Sticks was a simpler precursor to this post, comparing exponential-looking trends side-by-side and making the simple observation that this moment is highly anomalous, exceedingly brief, and surely can’t continue. Here, we separate growth from scale to see who deserves more of the blame.
Separating Growth and Scale
My intuition going in was that scale is a more important driver than growth in effecting ecological harm, so that stopping growth only stops the acceleration, but not accumulating damage. However, one could try to make the argument that the extractive practices causing such harms represent a one-time “outfitting” of humans with the basic things they need in terms of metals, lumber, agricultural land, solar panels, etc. and can coast to a constant pace once steady state is reached (via circular economy notions, for instance). I don’t happen to think this can happen for practical reasons, but decided to see what “model” the present data prefers. As we’ll see, recent changes in growth patterns handily provide a handle by which to differentiate growth from scale.
I focus on human population and global energy use as a means to characterize the physical scale of the human enterprise. Both are plotted below in terms of scale (left) and growth (right). In the growth plot, the fractional annual growth rate is shown in blue (binned in the case of energy to suppress distracting fluctuations), and the absolute growth (change in scale) as red circles (binned over periods of at least 10 years).
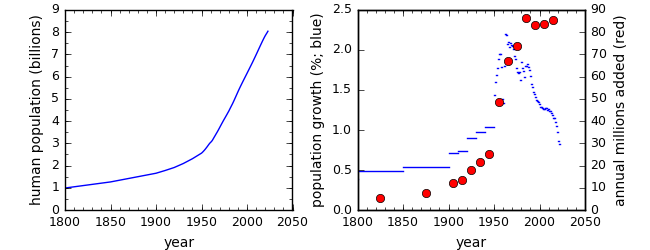
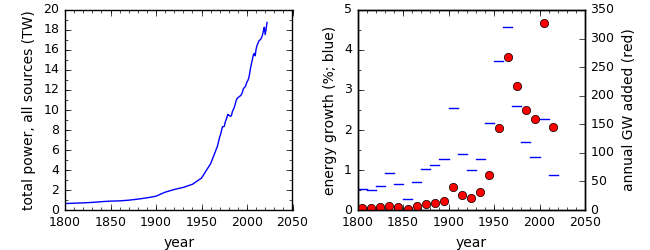
The growth rates for both measures peak in the decade between 1960 and 1970, then moderate from the peak by a factor of two or more (falling fast in the case of population). But the absolute growth is a product of rate and scale, so that declining population growth rate conspires with the continued overall rise to result in a nearly flat absolute growth, adding approximately 80 million people per year for the last four decades (though falling abruptly to 68 million per year averaged over the last few years). In energy, the absolute rate fell from the 1960s peak by approximately a factor of two, with the exception of a spike in the decade from 2000–2010—almost entirely due to a surge in coal use by China.
A key question in what follows will be: Does the metric in question rise like scale, lie flat like absolute growth in population, or fall by a substantial fraction like energy growth or population growth rates? In other words, is it a matter of “fitting out” an initial surge or of annual satisfaction of the scale.
Comparisons can be less than obvious at first glance, because some quantities are presented as rates (e.g., annual amounts), while some are total amounts (e.g., wildlife populations). Rate plots are easier to assess: has the rate stalled or declined in a way that is commensurate with growth trends since about 1960, or has it gone up in a way similar to the overall scale of population and energy? For cumulative plots, one needs to look at the evolution of the slope: is the thing getting worse faster or slower than it was 60 years ago?
Materials Use
This isn’t the order in which I looked at things, but it’s an easy place to start, and won’t interrupt the biodiversity focus to come. Compared to data on ecological health, it’s not too hard to lay hands on records of global resource use. One publication I ran across has some useful graphs for a few raw materials in common use. The first graph shows annual extraction of copper, zinc, and lead since 1900, usefully.
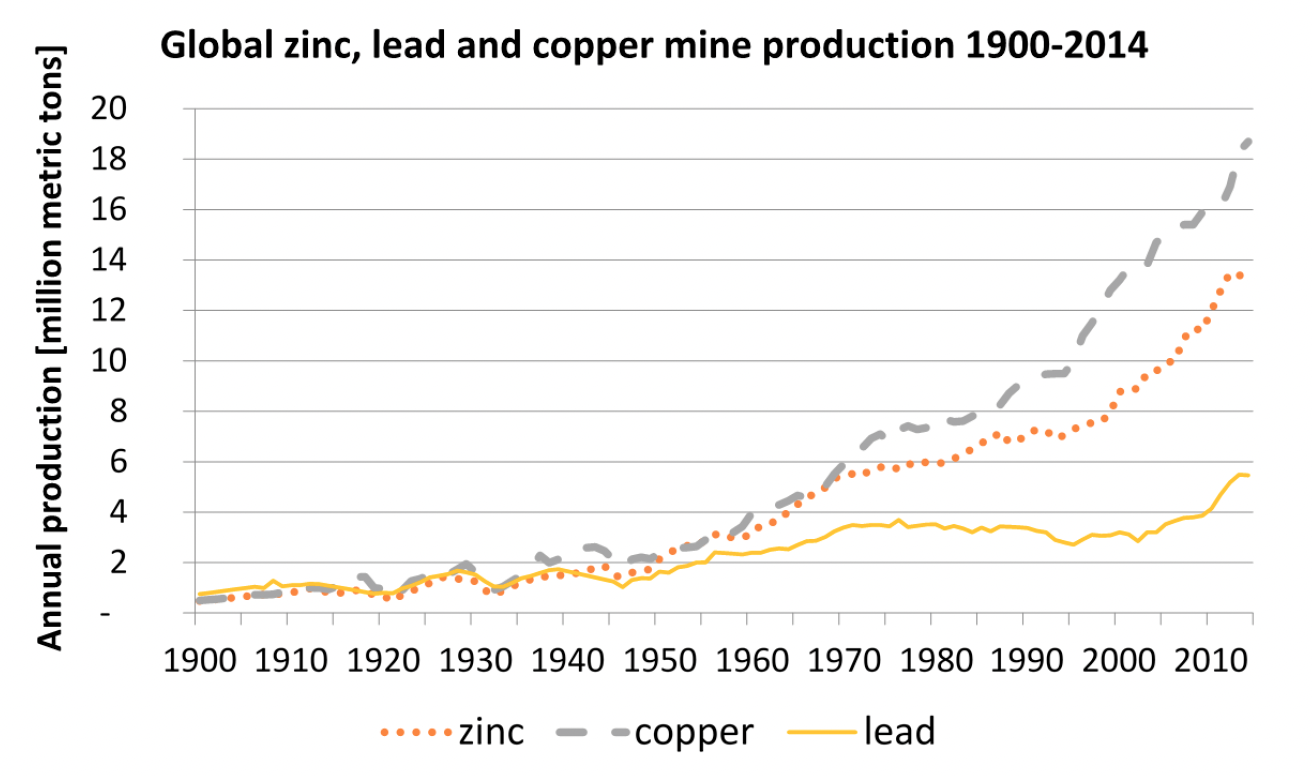
From Grandell & Höök, 2015.
All three are clearly higher today then they were at the peak of growth around 1960. In fact, all have at least doubled—not at all consistent with growth’s moderation by a factor of two, or stagnation in terms of annual addition of people. Meanwhile, the scale of energy and population did more than double in the same period.
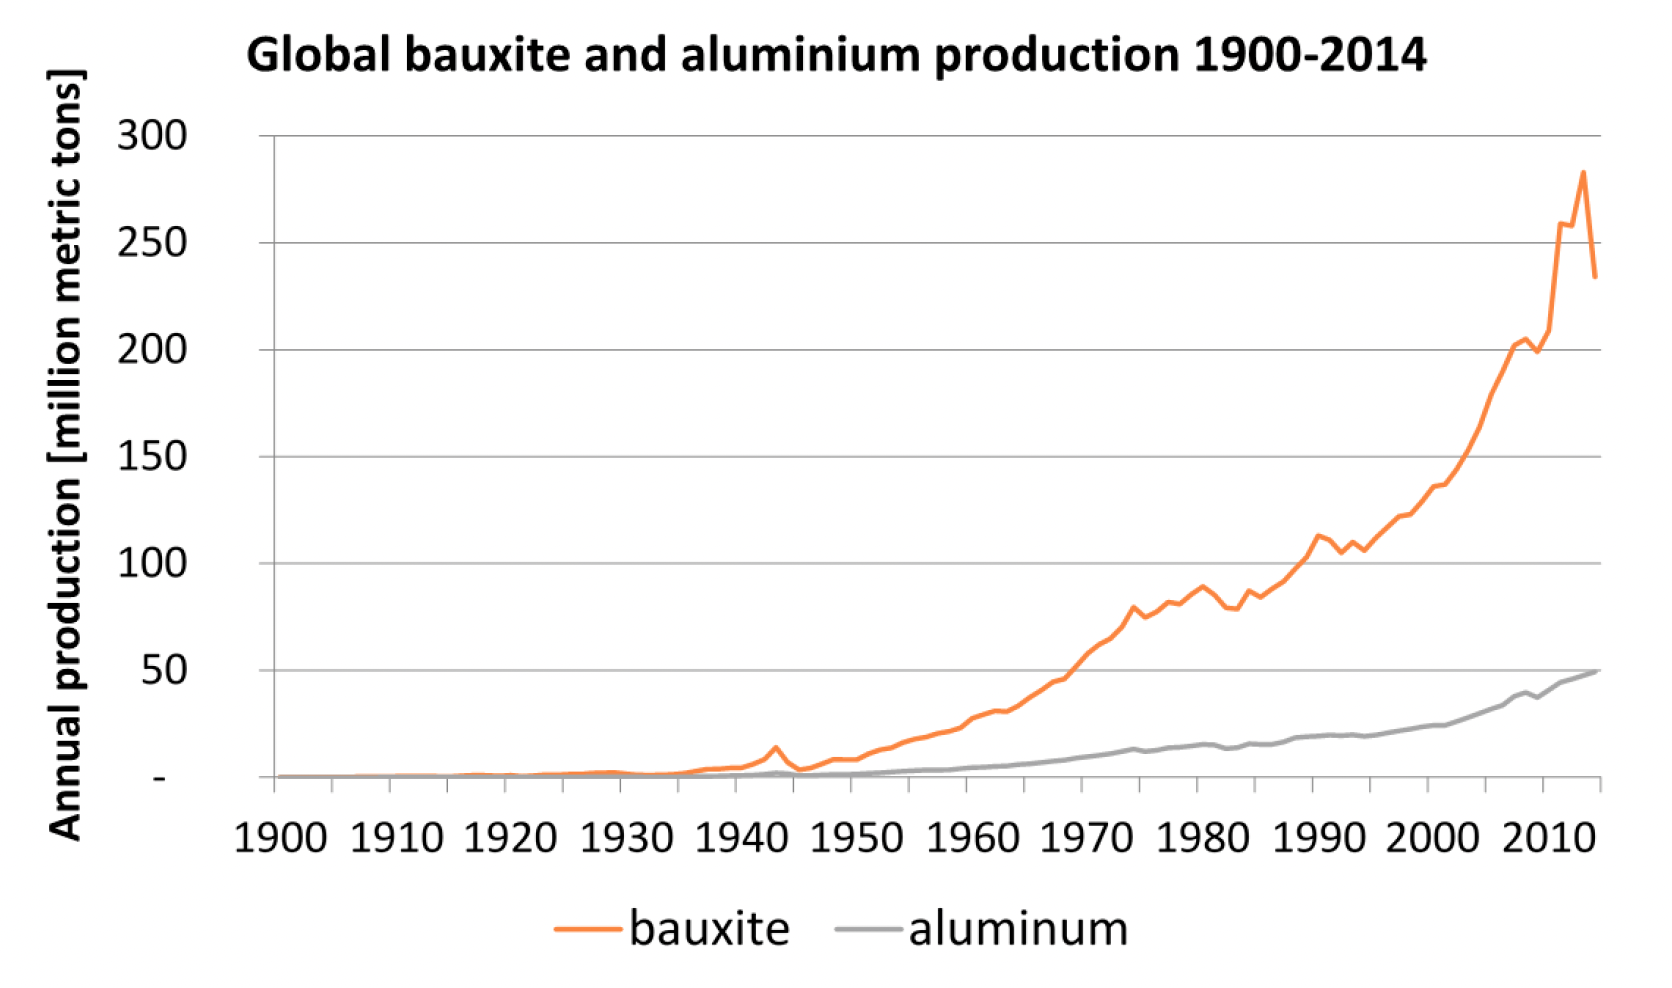
From Grandell & Höök, 2015.
The story is similar for bauxite and aluminum: the annual rate is clearly higher today than in 1960, not static or down to half the 1960 value.
Timber tells a similar story:
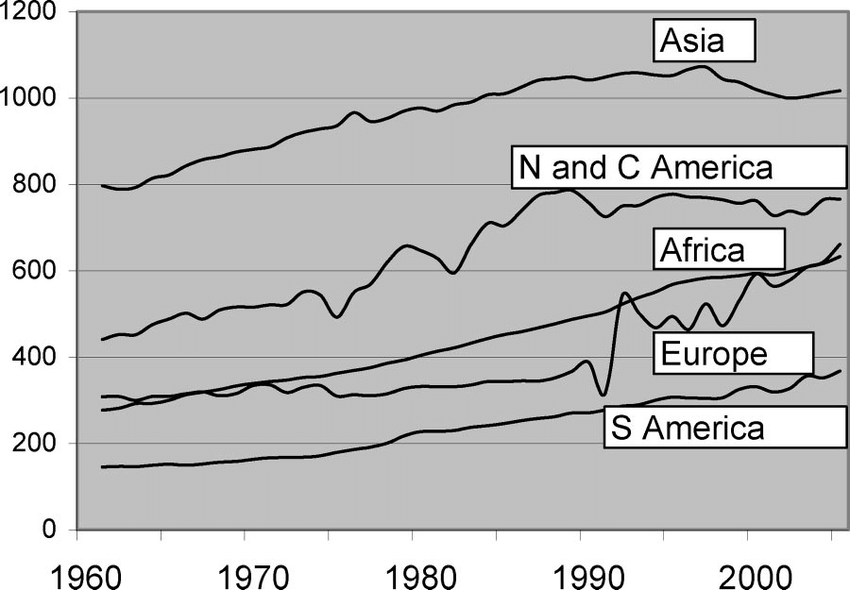
From Kirilenko & Sejo, 2008. Units are said to be billions of cubic meters of annual production.
From 1960 to 2005, in no region of the world did annual production of timber moderate alongside growth. The total global activity almost doubled (77% increase) over this interval rather than stagnating or tumbling by a factor of two as growth did.
The result for all of these resources is clear: scale is a more apt correlate than growth. The curves bear a family resemblance to the hockey-stick scale curves: far less resemblance to the peaking growth curves. A confounder in this is that per-capita resource extraction has also risen for many materials, in association with economic growth. That’s part of why I prefer ecological measures that are not directly driven by market activity. It’s also why I use a physical basis like energy as opposed to the more artificial measure of economic scale in this analysis.
Extinctions
My first instinct when conceiving this post was to compare the trends in scale and growth to extinctions, using the handy table of recorded (formalized) extinctions as reported on this Wikipedia page (which I also used in a previous post). But this approach has three problems. First, extinctions only become formally accepted sometimes decades after the last documented sighting, so the recent end tapers off, artificially. Second, extinctions represent the endpoint of a tragic population decline and thus can lag significantly behind the cause. Third, recorded extinctions are very conservative and likely the tip of the iceberg. Restricting the count to recorded extinctions suggests a loss of about 4 species per year, while the experts debate whether the actual total rate is 24 or 120 per day!
Nonetheless, since I took the time to make a plot and find some value in the visualization, here it is.
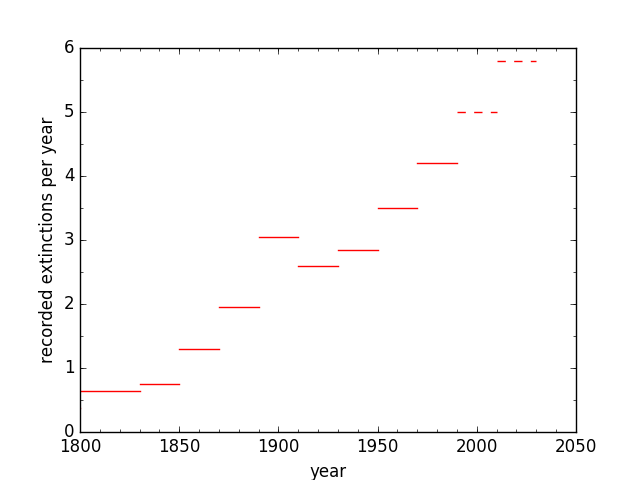
I “cheat” on the last two bars, fabricating a linear extrapolation to provide a visual impression of what is likely going on. After all, the latest research is not pointing to a reprieve in the sixth mass extinction, and population declines—extinction’s necessary precursor—appear to be as dire as ever. In any case, the extinction curve more likely resembles the upward trend in scale rather than the peak and fall in growth. But, it’s not the right dataset by which to judge whether scale or growth is the primary culprit, even if it is ultimately perhaps the most important consequence of modernity’s meddlesome ways.
In a Pinch
While the table of recorded extinctions might not be well suited to the task at hand, extinctions are so important that I don’t want to totally give up before moving to other measures. Noting that extinction rates are up some 100 to 1,000 times the background rate assessed over millions of years, we can compare these bracketing endpoints of extinction rate increase to the scale and growth rates of human population.
First exploring the hundred-fold case, in the 4,000 years since human population has increased one-hundred-fold, population growth rates have moved from about 0.05% per year to roughly 1% per year—thus a more modest factor-of-20. Already in this gentler case, it appears that scale is a closer match than growth to the increased extinction rates. In the case that the extinction rate is 1,000 times higher, we can go back 9,000 years when human population was one-thousandth what it is today. At that time, growth rates were not much different from the 0.05% per year that applied 4,000 years ago, so that again the scale would appear to be better able to match the change in extinction rate. In other words, growth rates don’t have the quantitative “oomph” that scale does, and can’t account for the large increase in extinction rates the way scale can.
Wild Spaces
Let’s take another “easy” swipe before getting to more detailed data. In a post from a couple years back I collected the numbers presented in a “witness statement” documentary by Sir David Attenborough, in which the percentage of wild territory remaining was periodically updated throughout the program. A subset of the table rows are replicated here, after interpolating two rows of the original table to present a value situated near the epoch of peak growth rate (bold font, here).
| Year | Population | Wild Spaces |
|---|---|---|
| 1937 | 2.3 B | 66% |
| 1969 | 3.6 B | 59% |
| 1997 | 5.9 B | 46% |
| 2020 | 7.8 B | 35% |
The (approximately) three decades that ramped up to peak growth therefore saw a 7% decrease in absolute terms, while the following (roughly) three decades saw a larger 13% drop. In relative terms, the first interval decreased 11%, while the second decreased 22%: double the rate. The 23 years at the end (a shorter interval) shows 11% absolute and 24% relative decline. Since the last interval is shorter and the drop larger, the relentless trend is one of accelerating pressure on the world, not a moderation as growth stagnated or slowed. Wild spaces, by this accounting, better follow scale, not growth.
Deforestation
According to the Global Forest Watch, which uses satellite imagery to objectively assess forest cover (as opposed to official government reports whose classification of land may not match the evolving facts on the ground), it appears that the rate at which deforestation is occurring globally is on the rise over the last twenty years. Some pockets might experience reforestation (like the northeastern U.S.), but such “shell games” hide the impact of exporting environmental costs (resource extraction) overseas.
Since suitable satellite imagery does not extend back to 1960, it is not possible to get an assessment of the evolution over the whole period of growth moderation using a uniform methodology, but the fact that the recent trend in deforestation is opposite the longer trend in growth is inconvenient for those who might want to blame growth over scale.
Biodiversity
It is difficult to find data on biodiversity that would allow one to track various measures of ecological health across the twentieth century. Many of the measures start in 1970, which is at least something.
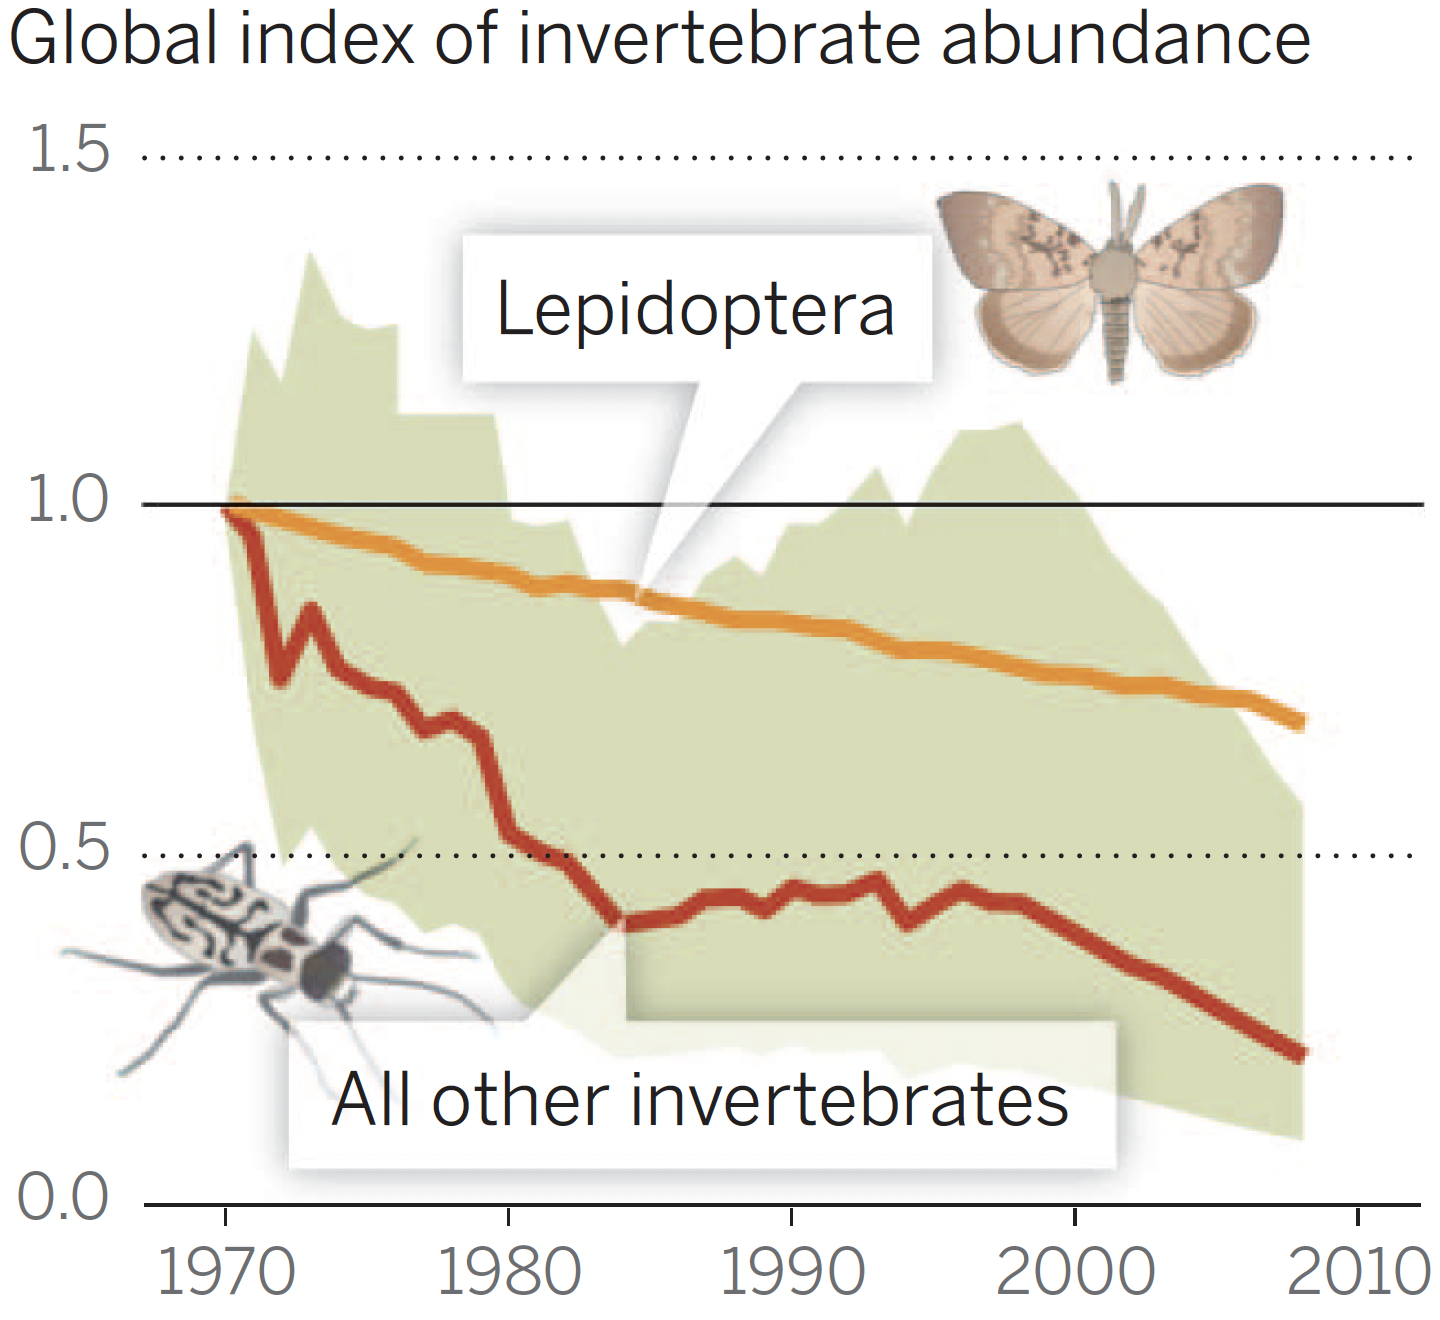
A figure from Dirzo et al. (2014) shows populations of invertebrates and a lepidoptera subset (butterflies and moths). Neither trend indicates any sign of moderation since 1970. The invertebrate data are noisy, but the recent trendline is completely consistent with the overall trend—and to the point: not half as fast, as one would expect if growth rates were the driver. Our use of energy, for instance, exacts ecological tolls, and those tolls might be expected to accumulate as long as the foot is on the gas pedal, whether accelerating or not.
Loads of other reports express alarm about population declines. Insects and birds are disappearing at rates of 1–2% per year. The U.S. and Canada have lost an estimated 3 billion birds since 1970. These statistics do not in themselves answer the question about growth vs. scale. But I will note that the latest messaging is best described by one of the following two choices (try to pick the right answer):
- Oh my: animals are disappearing at unprecedented rates, constituting a biodiversity emergency that may even signal a sixth mass extinction.
- Thank goodness: the high rates of animal disappearance that peaked in the second half of last century have moderated, so that we may be out of the woods and on the road to recovery.
I’m just sayin’. Things aren’t looking great, and the alarm bells are getting louder as the mounting crisis becomes ever-more apparent.
In gathering data to compare against scale and growth, I confronted a sad fact: for large population declines, absolute losses can appear to be moderating, but only because fewer critters are left to eliminate. Yay? Mathematically, in an exponential coast toward zero at a constant rate of decrease (like 2% per year), the losses appear to get smaller in proportion to the diminishing population, yet offering no cause for celebration.
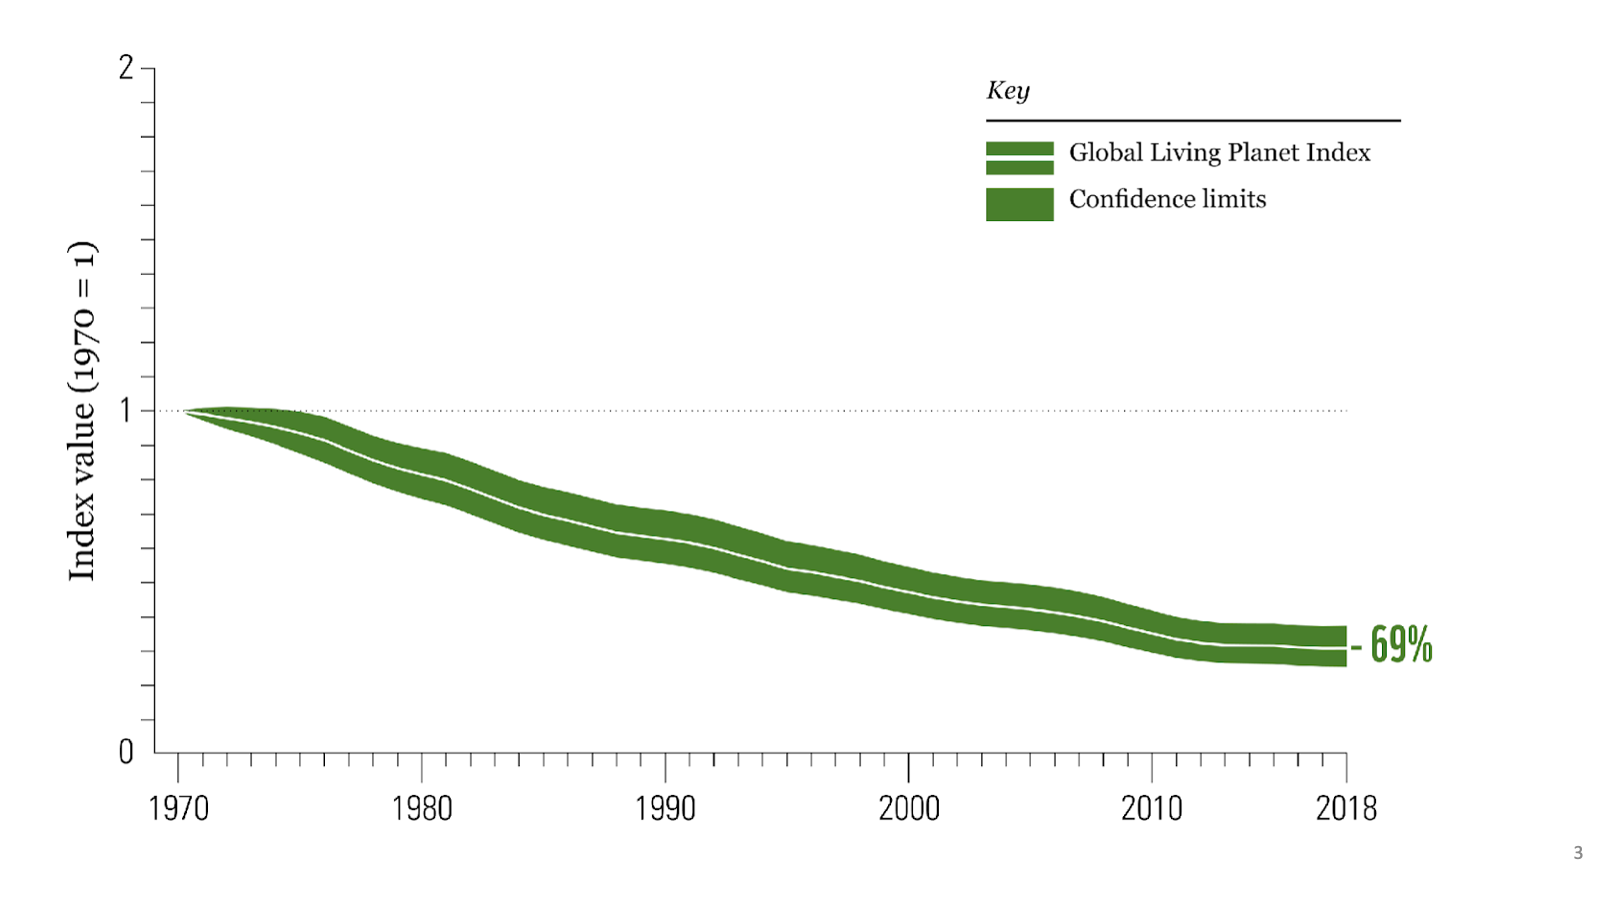
For instance, the Living Planet Index value tracking average decline of vertebrate populations dropped below its 1970 value by 37% over the first 20 years. In the last 20 years of the plot, the decline looks smaller, but starts from a smaller baseline. The recent decline is actually 39% of the 1998 level—faster than the earlier 37%.
Scale, not Growth
I should note that I did not cherry pick, here. I looked for available data on resources and ecological health that I deemed to be relevant and important, prepared to be surprised. Except, I wasn’t.
In principle, following the analog of a PID loop in control theory, the response can be Proportional to scale, sensitive to the accumulated (Integrated) effect of the past, or reactive to the rate of change (Derivative). Generally speaking, all can operate at once, and I imagine all play some role in ecological impact: scale (proportion) might dominate, but accumulation (integration) of pollution, degraded lands, and broken ecological interdependencies all contribute, as does some “one-time” surge activity associated with growth (derivative). So, it doesn’t have to be one and only one contributor. The key is that growth alone does not seem to be a very good metric for impact to our world, while scale (and the very similarly-behaving integrated effect) seem to account for what we witness more directly.
For reference, a purely exponential curve has a constant (flat) growth rate, but the scale, integral, and absolute growth are all exponential in character. Were it not for the break from exponential growth seen in the recent moderation, this exercise would be pointless, as all behave similarly. Also for reference, in a steady state situation, growth is zero (in both rate and absolute terms), scale is steady, and accumulated effects rise linearly.
It makes sense to me that scale—more so than growth—is what drives the system. An even better case might be made for cumulative (integrated) losses in the context of non-renewable exploitation and other long-lasting damages. Maintaining a steady 8 billion people on the planet in the mode of modernity would be accompanied by a constant flow of mined materials, used-up (degraded) land, accumulated waste and toxins, fragmentation of habitat, and inexorable, irreversible species loss as animals struggle to find the wild space and food they rely upon. The alarming rate of biodiversity loss is what we would expect to see as a result of inheritance-spending on a finite planet.
If the story was that a 20-year-old human acquired a certain amount of “inheritance” from the earth’s coffers, then needed no more non-renewable resources or generated no more harmful waste from that point forward—later passing these items to the next generation so they needed no new materials and created no new waste—then I could see the argument that we might heavily tax the earth in growing to our current scale, but thereafter could ease off and let the planet recover. But that’s not how things work. Adults in this world, living in modernity, extract and dispose a continuous stream of non-renewable resources (including aquifer water used to grow food). Maintaining scale amounts to a burn rate of non-renewable expenditure and harmful waste, and at a magnitude far too great for Earth, despite all her grace, to accommodate.
Appropriate Scale?
The obvious question, then, is what scale of human activity is Earth capable of supporting? Nobody knows. Already by 1800 Europe was demonstrably unsustainable—chewing through forests faster than they could be replenished. In fact, ecological trends have been essentially terminally downward since agriculture began, and the jury is still out on whether an agricultural mode can exist long-term in ecological balance (it hasn’t yet, importantly). If it can’t, it must fail, as nothing survives without an ecological underpinning.
So, don’t ask me. My sense is that we are currently orders-of-magnitude beyond a sustainable scale. The precautionary principle tells me that we ought to wind things down dramatically and hope it’s enough—rather than try to hold on in the face of loads of evidence that it’s not working out. Just halting growth is insufficient, as hard as even that is to accomplish by intent. Since we ultimately have no choice in the matter, growth will inevitably terminate, reverse, and continue contracting as long as it must before failing communities of life begin to recover and seek a new operating point. The best we can do is accept the ride down, in a spirit of humility, finding joy in something other than technology and modernity. Since we were able to do just that for 95% of Homo sapiens’ time on the planet, I think we’ve got the constitution to do so again.
Hits: 2196
Despite best efforts to the contrary, I keep coming to the conclusion that survival of the species is fundamentally dependant on a significant depopulation event – the sooner the better, despite the tragedies that will befall us all. There is no evidence that we can change our ways willingly to embrace a harmonious existence with nature and ourselves – and we must embrace the consequences of that failure. There were choices along the way – and we were informed and educated – but chose to ignore them.
There is little doubt that the toll from SARS-2-CoV will continue to rise, either as a primary infective agent or with chronic complications, but should it combine with another circulating virus eg HPAI H5N1, then we are in a different territory.
But, as you have pointed out before, a rapid depopulation event is not without significant risk of developing into an extinction event – nuclear power meltdowns and aerosol collapse will undoubtedly impact survival prospects.
If we were sensible, we would acknowledge our predicament and take steps to make safe – as far as possible – the existential risks we have inadvertently created for ourselves – and to plan and prepare, in the best way possible, for what is coming our way.
Yeah, "accept the ride down." At this point the only question is, "how will it play out?" Will it drag on and on for a couple of centuries? Or will there be a precipitating even that will tumble the whole house of cards? Who knows? I wrote a short piece, a future history. With all apologies to Olaf Stapeldon (you really should read "Last and First Men"), here's a link to my tale. https://medium.com/illumination/looking-backward-b685cea1e034?sk=c504615828bdf16c714a4d6bfe584b1b
An excellent, prescient prospectus, Frank. Thank you for the link.
I agree that a SARS – MERS combination event is possible, but we now have a circulating zoonotic virus with a higher CFR – HPAI H5N1 – and given the potential for recombination in both virus’, then the armageddon scenario may well be closer than you suggest. It could take years in nature for such passage to take place, but I’m sure there are many curious genetic engineers currently working on their own version.
Let’s hope the solar maximum has a big surprise for us before then!
Considering steady state, even a nominally steady state economy would require growing energy use (to power and maintain added, accumulated, capital). So it would be a juggling act to maintain a level of energy use at a constant level. I suspect it would require a continuous economic contraction and, so, difficult to imagine how it would be managed.
You might be interested in the work of Prof Tim Garrett who has shown that the energy required by the economy is roughly a constant factor of accumulated wealth.
A continuing source of frustration for me is the amount of publicity given to "good news" stories about species making a comeback, such as this one:
https://www.worldwildlife.org/stories/eight-species-making-a-comeback
compared with the relative lack of space given to information about how bad things really are (such as your blog). I suppose WWF think that if they appear too pessimistic, their donations might dry up, so they have to put on a permanently optimistic, "we can do it" face. Still, this lack of balance probably distorts public perception.
The delusional optimism and denial of reality depresses me to no end. Our entire modern way of life is not real. I much prefer reality.
And talking about reality is a great way to lose friends, I've discovered.
I would like to suggest you to read some works of Prof Fressoz, a Paris professor. His research shows that the extracted volumes of virtually EVERY raw material has increased monotonically since the onset of industrial revolution. Apart from wool, it appears.
Cheers and thank you .
Orders of magnitude beyond a sustainable scale is correct, I'd say. And it's clear that the downscaling will be involuntary,and occurring this century, probably starting before mid-century. Try explaining this on most mainstream forums, and you'll quickly realise that we exist in a culture of ecological ignorance. The natural world now is a shadow,compared to the exuberant abundance that existed before we started exploiting soils for our agriculture,and then the sequestered carbon. When the fireworks show ends, what remains will be a wasteland.
I am embarrassed by how many words it usually takes me to express very similar sentiments!
No. You've done a very fine job. Brief summaries like mine explain nothing, really. The detailed explanations are the hard part. My comment was just a brief confirmation.
Growth vs Scale.
Here is a useful back of the envelope thought experiment: On a sheet of paper draw 8 squares of approximately 1 inch in a row. Imagine in this system that growth (population, energy use, material resource use) is 2% per year. At 2% each square now represents about 35 years (70/2% yr = 35yr). place the time scale at the bottom of the row of squares, year 0 at the far left, 280 years at the far right. Or if you want to get cute use Thomas Malthus birth date on the far left (1766), and 2046 on the far right, Each block advances 35 yrs; 1801, 1836, etc.
In the first block place the number 1. This represents population, energy use, material use. In each time period our system doubles at 2% exponential growth.
The period 2 square at 2, the period 3 square at 4, then 8, then 16, etc, with the last square at 128 units.
So we have exponential growth leading to increasing scale, growth was constant 2%. Notice that with each doubling the amount of resources consumed in the 35 year period is not only 2x the amount in the previous period, BUT it is more than ALL the resources combined from ALL previous periods. Let that sink in.
Now let's assume that for a particular key resource there is a finite amount available. It is not known precisely to the inhabitants of our system. The finite amount is 256 units. NOW, here is where this gets very interesting, At the boundary between square 7 and 8 our system has consumed 127 units or 50% of the resource. Half still remains!!! It took 245 years to reach this point. How many more years does our system have to operate with 50% remaining???
This was the problem that the authors of the Limits to Growth were trying to understand. The answer appears that we now stand somewhere in square 8 and have done too little too late to recognize our overshoot. We are trying hard to substitute electricity for fossil fuels, but the catch 22 is twofold: 1. It currently requires fossil fuels to build out the wind/solar/batteries and 2. The Law of the Minimum will limit the systems growth. Fossil fuels are not the only depleting resource in the recipe for industrial output.
Regarding extinction rates, I am curious to know how researchers of past extinction rates deal with species that may not leave detectable remains.
Yes, there are far too many humans and they (we) are destroying the natural world etc.
To be consistent, that's where you'd leave it, but then you say "we ought to wind things down dramatically".
An exhortation that anyone "ought to" take some action implies that they have a choice about whether or not to do so. In other words, they can decide on their actions. In other words, they have free will. However, 'free will' (or agency, volition, choice – whatever you wish to label it) is something you deny the existence of.
I won't make any further comments, as you inevitably get the last word in, then say "End Of Thread", acting as contestant and umpire simultaneously. Perhaps that's a desire for control, rather than a willingness to debate?
(Btw, I agree 100% that "we ought to wind things down dramatically" – but I can say so without inconsistency, as I accept the reality of free will.)
Oh boy—here we go again, for the last time. I invite most readers to skip this embarrassingly long response.
First, I terminate threads-to-nowhere (impasses) to keep the comment forum from being as tedious to readers as it can be for me. Many have volunteered praise (in separate communications) for my handling of thread termination. But you've earned more terminations than anyone else by far, and it must be frustrating to be the winner of that contest. But think of it like this. If you had a front yard and were generous enough to allow people to post signs in your yard, you would probably exercise some discretion over what you found to be acceptable and working toward an overall aesthetic for the benefit of others' experiences. If you managed your own comment forum, you might also sometimes disappoint people who submitted posts.
We seem to agree on many things (like modernity is a wrong turn), which I appreciate. Even when it comes to the thorny topic of free will, you agree that we're not defying physics or controlled by a soul. It would then be tempting to chalk up our stubborn disconnect over free will to semantics or definitions. I don't disagree that living beings make choices that have every appearance of being free, even if fundamentally deterministic. We're not simple like rocks. We respond to complex stimuli in complex ways that even we can't predict ourselves.
Where we disagree (thus more than semantics) is that I say it's all in the arrangement of neurons and other aspects of our physiology—also shaped by social stimuli and past experience (our neural networks are plastic and reconfigure based on countless stimuli). But being alive and not dead does not mean that some external agent outside of our base physiology sweeps in to magically control the puppet strings. In my view, there is no separate/dual "me" in control beyond the corporeal arrangement of stuff obeying physics. "I" don't control my neurons (by what possible mechanism obeying physics?): they control (are) me. No insertion point. My choices (complex responses to complex stimuli) are arrived upon by a process that has been tuned by billions of years of evolution alongside social evolution that started long before humans appeared. It's hard (maybe impossible) to conceive, but that is an insufficient basis upon which to reject the notion: we have no authority to decide how the universe works.
You have rejected the idea that we are nothing more than sophisticated and extraordinarily remarkable arrangements of atoms, and simultaneously have claimed to possess no cosmology (what else are beliefs that form the basis for rejection of things that don't fit with your cosmology?). Taking offense to and deriding the "just a machine" description is an understandable reaction, but based on a notional cosmology somewhere deep inside. I see the claim that we are more than neurons and other cells obeying physics as a nice bit of Cartesian dualism: separating an intrinsic "us" from the real-world dreck that we're built from. Something terrible must happen to your unclaimed cosmology when you confront the possibility that we are just atoms, and that "something" would be worthy of deep introspection.
As for invocation of "ought"… The fact that you see this as inconsistency on my part is convincing evidence that I have failed every time to get you to see the cube from the other angle, yet here I am prepared to fail again. When we say "ought," it triggers our social programming—or perhaps a subroutine in the machine, to elicit a squirm. "Oh no: my culture/society/clan is giving me a corrective signal." Our brains are wired (evolved) to give such things serious attention. Our neurons know what to do. I'm simply an element of our culture attuned to a danger most around me are not seeing, and invoking the appropriate social communication to elicit a response that I (my pile of atoms/neurons!) process as being appropriate to the stimulus. We needn't make a big deal of it: I'm just doing what my organism is going to do, utilizing the vocabulary of our people, because that's what we do when trying to stimulate a response that seems beneficial to the collective.
Now I will double down on my prerogative to moderate this comment forum and say that this is the last free will squabble the two of us will air here. I also apologize to readers who have patiently endured the spectacle and tolerated a very long-winded final attempt on my part. My atoms made me do it.
[Edit: was meant to reply to the lengthy tmurphy comment above.] Ok well, as you say, we do agree on the big issues affecting the planet and all lifeforms on it (modernity being a disaster, exploiting/killing/commodifying all non-human life (and much human life), overconsumption, pollution etc. etc.).
I won't mention the F-word again, and thanks for your continual good humour throughout our (amusing (to me, at least)) exchanges.