Stubborn Expectations

The major development underpinning the prospect for an early-century peak in human population and even earlier peak in civilizational power is a rapid and seemingly unexpected decline in fertility rates across the world. All regions except Africa are now below the replacement rate, and still falling.

This short post—probably my last on the population topic for a while—is centered on the following animated GIF showing how the United Nations’ demographic models have expected total fertility rate (TFR) to evolve into the latter part of this century.

U.N. TFR projections from 2010, 2012, 2015, 2017, 2019, and 2022.

Every few years, the U.N. releases a demographic projection model that includes an expectation of how TFR will behave going forward.  I have already pointed out the glaring discontinuity (kink) at 2020 in the latest projection and a gallery of systematic major misses at the country level.  What the animated GIF above helps us see is how stubborn the imagined far future is—consistently aiming for a one-size-fits-all convergence.

I have referred to the notional TFR endpoint as a “magnet,” acting like a theoretical convergence point to which all regions are attracted.  We see how persistently influential this magnet is on projections in the sequence above.

Continue reading

Views: 2270

Peak Power Video

I’m on a video kick lately, finding that it’s a good way to capture key points and reach people who never would have stumbled onto Do the Math. Here is a video to accompany the latest post on peak power.

I also added a playlist to my YouTube channel that has other appearances I’ve done (podcasts and the like). While I was at it (as I learn this space), I added chapters to my channel videos to make it easier to find key content. Enjoy! I think I’m also supposed to say: please like and subscribe—but I don’t know if I’m doing this right, yet.

Views: 475

Brace for Peak Impact

Image by Paul Brennan from Pixabay

Guilty as charged: my recent postings have been all about human population and when it might peak. I don’t mean to be a bore, but it’s an important topic connected to planetary limits, human impacts, ecological health, and the appealing prospect that a near-term peak may offer an earlier off-ramp for modernity. In the past, I have stressed the point (in a blog post from 2013 and later in a textbook chapter) that population per se isn’t the phenomenon of greatest concern, but its multiplication by resource usage. It’s the combination that launches us over the ecological cliff edge, commonly expressed by the I=PAT formula for impact on the planet.

In this post, I belatedly take my own advice and re-frame the population investigation in resource terms. Now that I have a demographic tool, I can ask questions relating to when we might hit peak power as a civilization. I use power (rate of energy use) as a proxy for all manner of resource dependencies, as energy usage correlates strongly with materials use and ecological impact. Plus, it is a readily-available measure.

So, given various assumptions about how fertility rates evolve regionally, and factoring in different models for regional survival rates and migration, when might we expect global resource use to peak and begin a decline? In tandem with this event, we might correspondingly expect peak industrial output, and peak rate of (accumulating) damage to ecological health—which includes our own health. In the U.N.’s standard demographic model, population does not peak until 2086 at 10.4 billion—largely bolstered by population growth in Africa, which the U.N. parameters indicate will climb to 4 billion by 2130 (we’ll see…). But, since Africa is by far the region with the lowest per-capita consumption, declines elsewhere could more than offset Africa’s population increases in terms of resource burden.

Enough speculation: let’s unleash the model and see what happens.

Continue reading

Views: 4457

Peak Population Video

I put together a short (13.5 minute) video to synthesize the main points from my exploration into demographic models and what it could mean in terms of an early peak. If you’ve read the first three posts in the population series (bomb, projections, whiff), then this offers nothing new. In any case, perhaps it is an efficient way to introduce or revisit the content.

Views: 584

Population "What If" Games

Image by StockSnap from Pixabay

Readers may have noticed that I’m on a bit of a demography kick of late, and this post is no different.  Several reasons contribute to this focus.  First, human population is an extremely important factor in the future health of this planet.  Second, I am fascinated by the prospect that population growth may not turn out to be as crushing as I had previously believed.  Third, having developed a tool for demographic projection, I want to get my money’s worth before scooting off to something else.

The first post in this series examined the unexpected realization (on my part) that current trends could put us on track for a global population peak in the next few decades—maybe deflating the population balloon before something pops. In the process of investigating how this squared with most projections that show a late-century peak, I came to understand the theoretical biases—especially in fertility—employed by United Nations demographers. This first post also explored possible implications of an early peak: how modernity would cope with such a major, unprecedented, and rather prolonged period of declining population. The second post sketched out a reasonably sophisticated demographic propagation tool I constructed tracking six regions of the world so that I might reproduce the U.N. projections and explore what I considered to be plausible variants in terms of both fertility evolution and survival/medical trends.  I also wedged in a bonus post exposing the repeated systematic failure of demographic projections to capture recent rapid trends in declining birth rates.  The models apparently don’t incorporate whatever drives this major phenomenon.

In this post, I examine a few implausible scenarios for the purpose of isolating and better understanding factors at play. I think of it as answering “What If” questions (calling to mind Randall Munroe’s excellent What If series of outlandish yet illuminating questions). What if fertility around the globe suddenly locked at the replacement value? What if things stayed exactly as they are today? How much earlier would population peak if Africa’s fertility fell as rapidly as other recent precedents? What if we suffered a pandemic or global resource war?

The first few of these explorations are not intended to be realistic as much as they are illustrative of the relative importance of various factors. I learned from the exercises, at least, and hope you will, too.

Continue reading

Views: 1727

Whiff After Whiff

Image by Anne and Saturnino Miranda from Pixabay

The word “whiff” is used in baseball to describe when the batter swings and makes no contact with the pitched ball. The term presumably derives from the sound of hitting nothing but air.

This off-sequence post acts as a brief update that I wanted to present, without making a full-fledged blog post out of it (in hindsight, I may have failed). In the last two posts (here and here), I noted that recent rapid drops in child birth around the world could conceivably put us on track for an earlier population peak than previously anticipated—possibly as early as 2040 vs. the 2080–2090 timeframe.

That would be big news, and makes me continually ask myself: where is the disconnect? Is it possible that demography models are that wrong? I have discussed already (and will revisit in the next post) some of the potential blind spots for how this century develops. But here I look backwards to see if the recent drop in child births was itself a surprise to the demographers. If so, then it speaks to dynamics at play not captured in demography models, and that’s important.

I used the 2022 United Nations World Population Prospects (WPP) data (public) to build a list of countries that had the largest fractional declines in total fertility rate (TFR) from 2010 to 2019 (pre-COVID), and that also had projections in previous U.N. WPP products back to 2010. I show how (not) well the U.N. expectations match the actual story for these cases. I also throw in a few other countries of interest, including the three most populous ones.

Continue reading

Views: 1826

Peak Population Projections

Last week, I reported the surprising realization that official population projections from the United Nations adhere to a notion of future fertility that appears to be immediately at odds with present real trends. The recent rapid decline in population growth—even pre-COVID—suggests that a population peak prior to 2050 is not outlandish, provided that current drivers continue to apply.  Recent declines in fertility rates, together with a flattening age distribution of young folks, combine to set the stage for population peak and decline.

In the previous post, I performed two embarrassingly crude projections of recent trends (simple curve fits) to demonstrate that a population peak as soon as 2042 or even 2033 should not be ruled out, and in fact seems to be where we’re heading if present trends continue.

I mentioned that I was working on tooling up a more sophisticated model to do some exploration of my own. The goal was to track the nuances of actual age distributions across the world, together with alternative ideations of fertility evolution (greater weight on what is actually happening lately), and allowance for non-monotonic evolution of medical care and life expectancy going forward. It was a daunting task, but I was consumed with curiosity and powered through the exercise over a few intense days.

In this post, I will give an overview of what goes into my demographic projection model, why I believe it works well enough to be useful, and what top-level questions we can explore using it.

Continue reading

Views: 10834

Watching Population Bomb

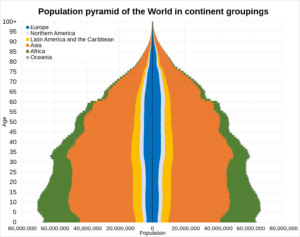
As a nod to human supremacy, any time we hear the word “population,” it generally goes without saying that we mean human population, of course. Other such words include health, lifetime, prosperity, intelligence, wisdom, murder, pro-life, culture. To many in modernity, it makes no sense to discuss the murder of an animal, the wisdom in mushrooms, or a culture among crows. Such self-centered arrogance!

But where was I? Oh my—I got derailed before even starting. This post is about population of the human sort. In the 1960s, the rate of growth of human population appeared to be on a runaway ascent, enabled by the fossil-fueled Green Revolution. This alarming phenomenon prompted Paul Ehrlich to write The Population Bomb in 1968, warning of the inherent downsides in such an uncontrolled explosion of humans. But interestingly, the word “bomb” can also describe a dramatic failure, or falling flat—as in bombing a test.

In the past, my attention to population has been limited to the following points.

  1. The growth rate is grossly unsustainable, has accelerated historically, and is a reflection of temporary fossil fuels (Section 3.1 of my textbook).
  2. Despite lower birth rates, population growth in prosperous countries constitutes the largest population-growth-related resource burden on the planet (not poor countries).
  3. The demographic transition that worked in a past age for today’s “developed” countries is not really an option for the rest in a thoroughly-exploited world. Also, the inevitable population surge and resource demand accompanying the transition is an ecological double-whammy that Earth is not obligated to (and cannot) support.

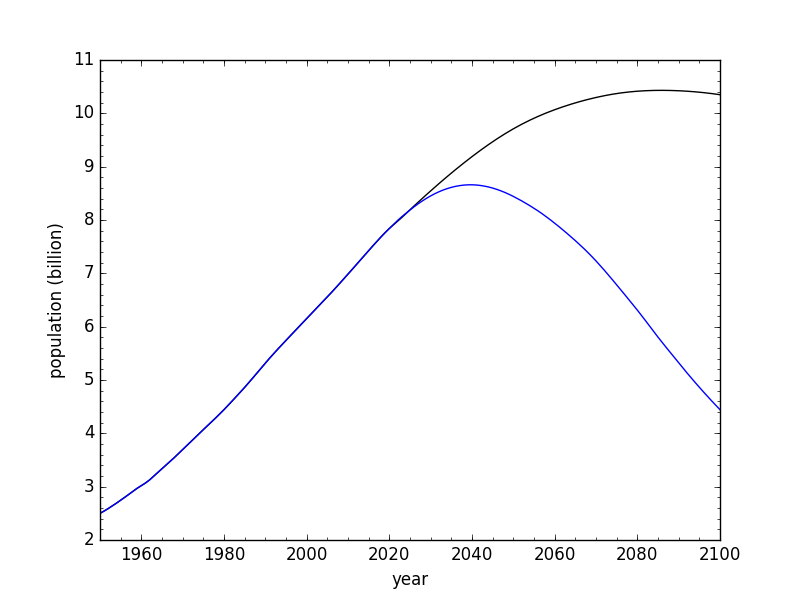
These views are still valid for me, with an asterisk on the first point that will be the focus of this post. Last week’s post included a plot of human population growth over time. I was struck by the recent phenomenon of rapidly declining growth rates, which I had noticed in tables (pre-COVID) but had never seen in visual form. Here is the relevant graph in a larger format, straight from the United Nations’ 2022 population report and associated data.

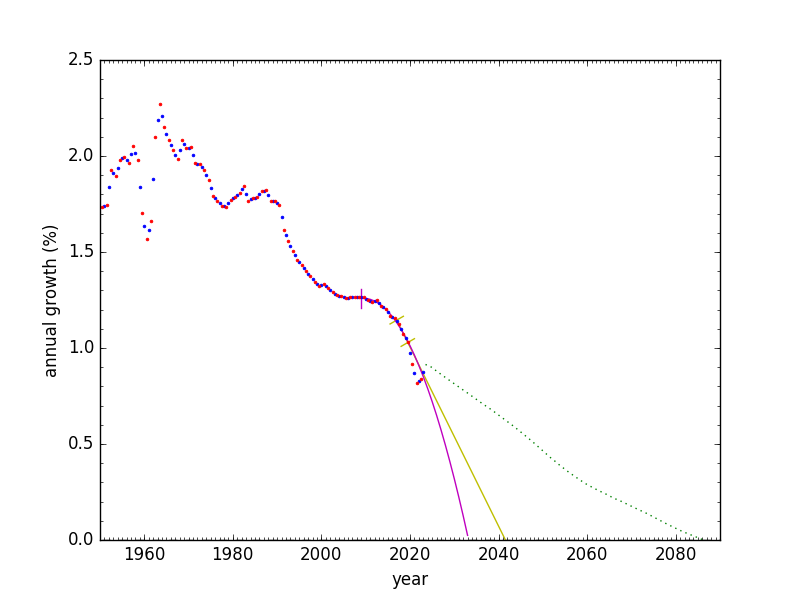
Data (dots) and projection (green-dotted line) from the United Nations. We’ll get to the solid curves later.

The annual fractional increase, in percent, is shown as blue or red dots, depending on whether tracking the July 1 to July 1 annual increase (blue, centered on the year boundary) or January 1 to January 1 (red, centered mid-year). The green dotted line is the U.N. 2022 projection for how growth rate evolves (look how it changed its mind on the slope!). When it hits zero, in 2086, the population peaks at 10.43 billion. Or their model tells us so. I’ll get to the magenta and yellow curves in due course.

The rapid decline in population rates in recent decades is impressive. The first plummet transpired from about 1988 to 2005, dropping from 1.8% per year to 1.25%. After a decade’s pause, the downward trend resumed, lately averaging 0.85% per year.

Since human population plays a huge role in the global meta-crisis, what do we make of these trends, and how might they shape our future?

Continue reading

Views: 6523

Growth or Scale?

Image by Peggy und Marco Lachmann-Anke from Pixabay

Demonstrating that growth can’t continue on a finite planet has been a favorite sport of mine in the past (e.g., here, here, and here). But it’s child’s play, really: not a difficult accomplishment. Still, as blatantly obvious as it is, a surprising number of people are surprised to hear that growth can’t last. I guess that’s what happens when an entire system is predicated on growth’s continuance. Exposing the foundation to be shaky can come as seismic news.

But let’s say that we (collectively) were able to accept that growth is a no-go for the future. Fine. Let’s just stay here, then, shall we? Maybe we fashion a steady-state economy that continues to support the present scale of the human enterprise (perhaps redistributed for better equity) but without those nasty ills of growth.

In this post, I do the simple “math” of presenting graphs (Do the Graph?) to try and ascertain whether the ills stem primarily from growth, or primarily from scale.

Death by Hockey Sticks was a simpler precursor to this post, comparing exponential-looking trends side-by-side and making the simple observation that this moment is highly anomalous, exceedingly brief, and surely can’t continue. Here, we separate growth from scale to see who deserves more of the blame.

Continue reading

Views: 2631

Can Modernity Last?

Image by Daniel Borker from Pixabay

Do the Math started out with a pair of posts about limits to growth. Galactic-Scale Energy pointed out the nonsense that results from continued growth in energy use, and Can Economic Growth Last? turned to the economic implications of stalled physical growth. This combination of topics later appeared in a dinner conversation between myself and an economist. The same pairing also evolved into chapters 1 and 2 of the textbook I wrote in 2021. And if that wasn’t enough, I published a paper in Nature Physics called Limits to Economic Growth based on the same theme. When I do podcast interviews, the hosts often want to step through this (powerful) logic.

Perhaps the result has me sounding like a broken record. It feels to me like the song “Free Bird” by Lynyrd Skynyrd. Fans will not allow the band to perform a concert without playing this classic hit. There’d be riots. I’ve had a lot to say following those two posts in 2011, and have especially taken a profound turn in the last few years. But the point remains central to our modern predicament, and until we all have it firmly planted in our heads that growth is a very temporary phase that must end, I guess I could do worse than repeating myself to new audiences—and to veterans holding up lighters.

In this post, I echo the bedrock question of whether economic growth can last with the question of whether modernity can last (see the previous post for definition and possible inevitability). Okay, nothing lasts. The whole universe is only 13.8 billion years old. The sun and the earth are only about 4.5 billion years old, and will be around in recognizable form for a comparable time into the future. Species typically hang around for millions of years. Homo sapiens is a few hundred-thousand years old. Depending on definitions, modernity has been around for at least a century or as long as 10,000 years—brief in either case, in the scheme of things. Nothing is forever, but how long might modernity last?

Whether modernity can last is perhaps a more important question than whether growth can last. The fact that growth can’t last is shocking enough for many. But it still allows mental space for maintaining our current way of life—just no longer growing. But is that even possible? I can’t be as confident in my answer as I am for growth, since the question of growth comes down to incontrovertible concepts and, well, math. Still, I strongly suspect the answer to this new question is “no” as well, and in this post I’ll expound on my misgivings.

[Note: I had another post in 2021 enumerating reasons to worry about collapse, which is a relevant but—I would say—less enlightened precursor to this piece. Since then, I have become aware of the important role of human supremacy, the materials difficulties associated with renewable energy, the crushing numbers on loss of biodiversity, and have released my anxious grasp on modernity—having better appreciated the more-than-human world and our role within the greater community of life.]

Continue reading

Views: 18561