

Image by Anne and Saturnino Miranda from Pixabay
The word “whiff” is used in baseball to describe when the batter swings and makes no contact with the pitched ball. The term presumably derives from the sound of hitting nothing but air.
This off-sequence post acts as a brief update that I wanted to present, without making a full-fledged blog post out of it (in hindsight, I may have failed). In the last two posts (here and here), I noted that recent rapid drops in child birth around the world could conceivably put us on track for an earlier population peak than previously anticipated—possibly as early as 2040 vs. the 2080–2090 timeframe.
That would be big news, and makes me continually ask myself: where is the disconnect? Is it possible that demography models are that wrong? I have discussed already (and will revisit in the next post) some of the potential blind spots for how this century develops. But here I look backwards to see if the recent drop in child births was itself a surprise to the demographers. If so, then it speaks to dynamics at play not captured in demography models, and that’s important.
I used the 2022 United Nations World Population Prospects (WPP) data (public) to build a list of countries that had the largest fractional declines in total fertility rate (TFR) from 2010 to 2019 (pre-COVID), and that also had projections in previous U.N. WPP products back to 2010. I show how (not) well the U.N. expectations match the actual story for these cases. I also throw in a few other countries of interest, including the three most populous ones.
The Top Drops
I will present six fast-decline countries in the order of greatest to least fractional drop in TFR from 2010 to 2019, before throwing on a few important population players. For each plot, the thick blue line reflects past data from the U.N.’s 2022 WPP effort. Dotted lines represent projections from WPP efforts in 2010, 2012, 2015, 2017, and 2019. Often the left edges are discernible to help sort them out. In each case, the latest 2022 projection (beginning 2021) is a blue dotted line, and fashioned (by the U.N.) to match up to the solid curve to avoid artificial disconnects. In some cases, I supplement with updated TFR reports from credible sources, shown as red circles.
Bhutan
Bhutan went from a TFR of 2.30 to 1.46 from 2010–2019, dropping to 63.6% of its 2010 value.

Bhutan has had a fairly steady track record, so that projections tended to be smooth extensions of the past curve. But the TFR recently dropped well below expectations, already well below where projections had it at 2040. The latest projection anticipates a modest “correction” to higher values that I can’t say I trust will materialize.
Timor-Leste
Timor-Leste went from a TFR of 4.85 to 3.34 from 2010–2019, dropping to 68.8% of its 2010 value.

This is an interesting case. Until 2019 (red dotted), the projections were very self-consistent. They did show a steep decline, but significantly delayed (by more than 20 years toward the end), and a little less steep. I surmise that data for this country was stale and incomplete, so that when better estimates became available, it was a bit of a surprise to see how quickly this country was dropping. That is: the model missed the dynamics that made for an early decline, and we again have a case of already beating previously-anticipated 2040 conditions.
Finland
Finland went from a TFR of 1.86 to 1.36 from 2010–2019, dropping to 72.8% of its 2010 value.
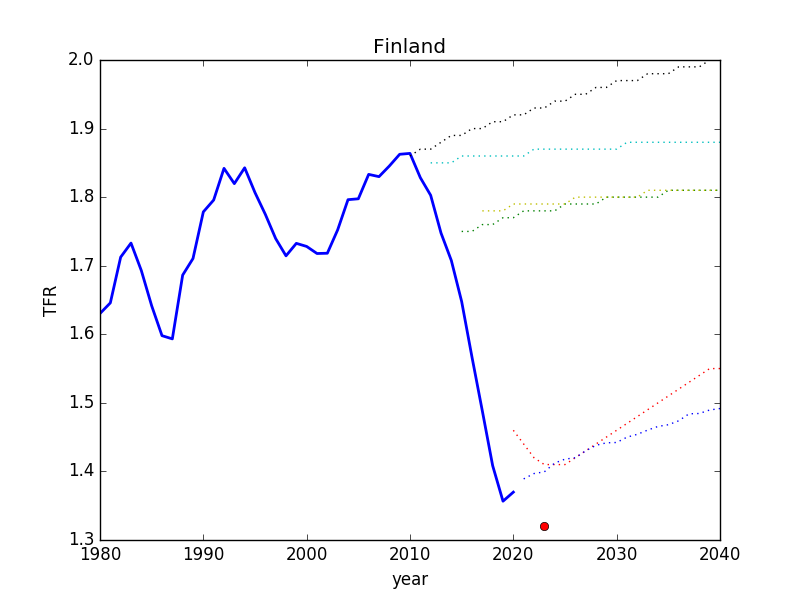
The Finland case is a little hilarious to me. It’s a European country that presumably has high standards for tracking births, deaths, etc. Indeed, the projections always start out near the data, unlike the previous case, suggesting good up-to-date information. But the message from 2010 was: “Pull up! You’re too low!” In 2012, 2015, and 2017 the message was much the same: “You don’t really mean to do what you’re doing: just stop this nonsense and get back on the corrective track we think you should be on.” (My mock U.N. ends sentences in prepositions, apparently: another no-no). In 2019, there was some concession that maybe it could drop a bit more, but let’s not get carried away: it’ll come roaring back up, surely! Will it, though? Is it listening to the demographers? The last year on the blue solid curve shows a baby uptick, but Finland’s 2023 release (red symbol) puts it at 1.32, continuing to fall.
United Arab Emirates
The United Arab Emirates went from a TFR of 1.79 to 1.33 from 2010–2019, dropping to 74.5% of its 2010 value.
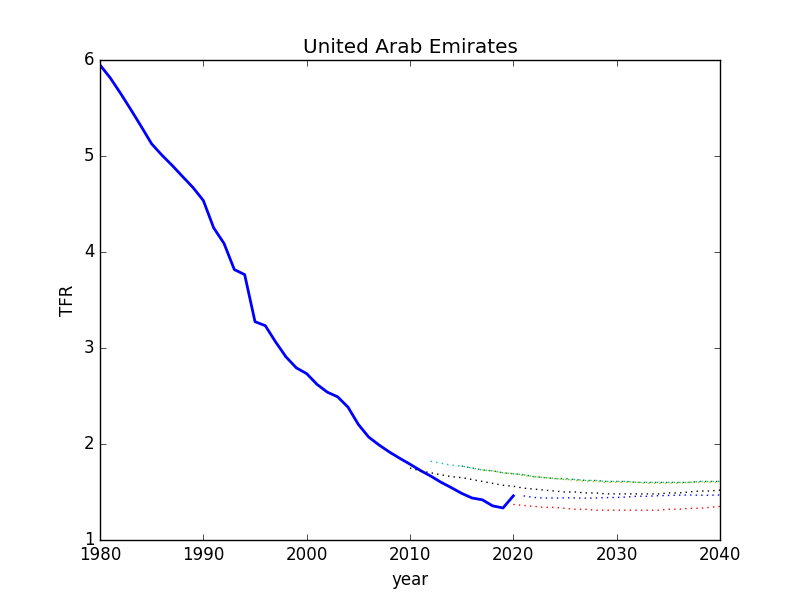
This one is a fairly business-as-usual extrapolation of a leveling curve. It did indeed drop below the earlier projections before ticking up again. Still, the latest data has it already below the 2040 projections from 2010 through 2017—well ahead of “schedule.”
Maldives
The Maldives went from a TFR of 2.32 to 1.74 from 2010–2019, dropping to 74.9% of its 2010 value.

No real beefs with this one. The 2010 projection appears to have missed an up-bump in a smooth continuation of older data, but subsequent models did a reasonably credible job of prediction, though systematically underestimating the rate of TFR decline (their favorite!).
Republic of Korea
South Korea went from a TFR of 1.22 to 0.91 from 2010–2019, dropping to 75.1% of its 2010 value. Pause to consider how low those are!

Okay: this one is pretty amusing to me as well. Korea has such a low TFR that it seems as if demographers simply don’t have a room in their imaginary house for such behavior to persist, and insist that fertility must execute a corrective rise any year now. “Pull up! Pull up!” But it just doesn’t. It has its own plans, and the gall to drop further against professional advisement. As was the case for Finland, it seems the 2019 model is the first to concede perhaps a smidge more decline before resuming a climb: a modicum of patience that was not respected. The latest data point indicates that the 2022 projection was another swing and a miss.
The Big Three
Now here are the three countries with the largest populations.
India
India went from a TFR of 2.60 to 2.11 from 2010–2019, dropping to 81% of its 2010 value. Importantly, it is now edging below replacement TFR.
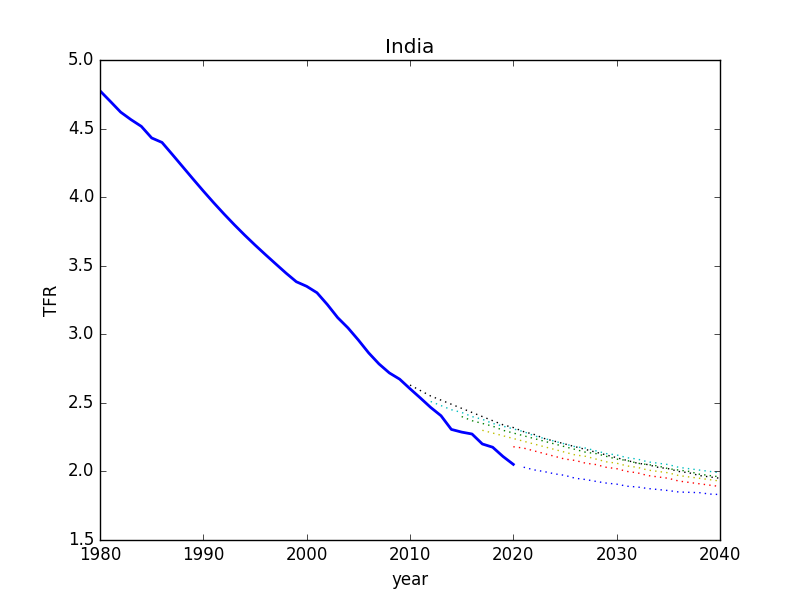
India’s declining TFR has been a smooth no-drama affair: a modeler’s dream. Despite this, models have consistently underestimated the decline rates, always expecting a bit of a pulling-up. Again, it looks like a bias toward higher TFRs. Maybe the 2022 projection (blue-dotted) is okay, but the slope is discontinuous. Based on the history, would we really be surprised if the real trend undercut the projection?
China
China went from a TFR of 1.69 to 1.50 from 2010–2019, dropping to 88.7% of its 2010 value.
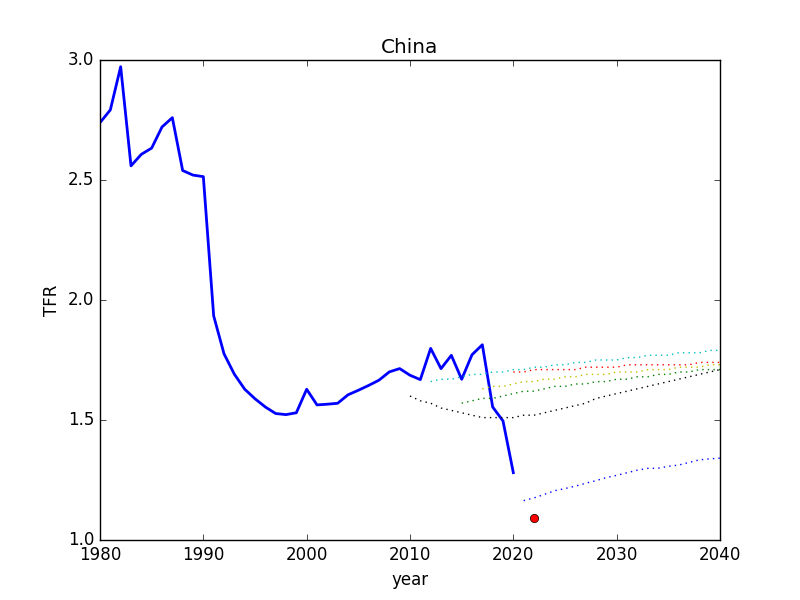
Like South Korea, China’s TFR has been hanging out lower than the demographers think is reasonable, so that projections tended to anticipate a slow “recovery.” From 1995 to 2017 it looked like this was exactly the dynamic, but then a rapid decline commenced (pre-COVID). Oops. The last data point (red circle) indicates that the decline is still in progress—again ignoring the wishes of the projection’s trajectory.
A side comment here is that China imposed a one-child policy from 1979–2015 (exceptions were granted depending on location and gender). It looks like an effective crackdown happened in the early 1990s. Keep in mind that TFR is a “real time” metric unlike total population, which is subject to demographic inertia. Ironically, the country seemed to stubbornly saturate above 1.5 under the one-child policy until the rule was lifted, after which time the country “dutifully” headed toward 1.0 for real. It’s behaving like a cat!
United States of America
The United States went from a TFR of 1.93 to 1.69 from 2010–2019, dropping to 87.4% of its 2010 value.

This plot calls to mind the American flag: stars and stripes. Oh, say does that star-spangled banner yet wave… an expression of patriotism? Anyway, somewhat resembling the Finland drop, the U.S. has embarked on a rapid decline in TFR starting around 2008 (year of financial crisis…). The U.N. model, fully up to date on the stats kept saying: Nope. Nope. Nope. I’m not listening! Perhaps it was exciting in 2015 when the madness may have appeared to be over based on that little “shelf.” The next two trends launched from this shelf to execute an anticipated “recovery.”
Bonus: Italy
Okay, I threw in a bonus round, because I was curious to see another example of a low-TFR European country. This, then, is not part of an unbiased sample, but also does not represent a “cherry-picking” process: Italy was my first/only pick, and here it is:

The impression one gets is similar to what derived from previous examples: the U.N. model seems to be allergic to low TFR, desperate to get things “back to normal,” and whiffing on predicting downturns, to this day.
My Take-Away
I embarked on an unbiased exploration of the question: how well do the U.N. demographic models capture sharp declines in birth rates of late, and how are they performing on the most populous countries?
I can’t say that I was impressed. I expected the U.N. to anticipate at least some of the sharp declines, but in no case did they appear to “get out in front” of a decline, seeing it coming based on a deep understanding of underlying demographic drivers (that’s not how their modeling works: not systems-based—no room for unexpected emergent phenomena). This is especially true for low-TFR countries, where the model impulse to pull up seems to be rather strong.
My impression, then, is that the global rapid decline in TFR, as seen in regional aggregates prior to 2020, is not a feature understood by and captured in the models. It’s a new phenomenon whose (many) origins are not apparently represented in mainstream demographic models. In the end, something is making these trends go down beyond the model’s awareness, and that something is more likely to still be with us than to suddenly vanish. Perhaps the youth of the world are reacting in a “mature” fashion to the uncertainties of the future, and the justifiable sense that things are broken.
If the models are being surprised by recent developments across the world, then we should not be surprised if they whiff on the near future as well—not to mention the far-more-speculative late-century story. As I have dipped a toe into the world of demographers, I am truly impressed by the granularity and sophistication in their projections, but taken aback by what appears to be a faulty foundation of assumptions that render the exquisite attention to detail perhaps a bit misplaced—like perfectly arranged deck chairs on the Titanic. The world follows its own evolution, and will likely continue to thwart extrapolative projections based on a continued assumption of business as usual, dependent upon a context that is disappearing. I think this century is the one that breaks BAU in a big way.
Next post in this series on near-term population peak.
Views: 3322
More data is needed to determine the cause of the TFR decline. Are women trying to have children and failing? Rates of birth control use would be informative if it is possible to find the information. Same with abortion rates. Perhaps the opportunity for getting eggs fertilized is declining due to women remaining single or celibate?
If the decline in TFR is deliberate, it should be relatively easy to determine why, but perhaps it is not a choice women/couples are making. Perhaps the reported decline in male sperm counts has something to do with it. Perhaps exposure to endocrine disrupters is rapidly expanding its geographical reach?
Regardless of the cause, once the TFR drops very low for long enough, demographic interia will keep the total population declining for a very long time. Women can't have babies if they don't exist.
Love your work. Thought you might be interested in this interview with John Lee. At the 25 minute mark he talks about how China's population numbers are overstated by a lot. Just more to add to your thoughtful mix!!! Curious what you will think of this…
https://palisadesradio.ca/
https://www.youtube.com/watch?v=2WFI8rIBRYA
It is indeed interesting (and heartening) to see low fertility countries going lower. With China in that category, it should have an impact on projections. But what Tom doesn’t look at is what is happening in the countries where most future births will be (not the biggest countries, but the product of their population and fertility). That’s what I focused on in my paper here: https://doi.org/10.3390/world4030034. Most of them had less fertility decline in the past decade than the UN had anticipated.
Thanks for pointing this out. Indeed 88% of the projected growth in the U.N. medium case between 2020 and the 2086 global peak is projected to take place in Africa. Extending their model puts Africa over 4 billion around 2130 (1.5 billion today). But extrapolations work only if the context doesn't change, and I probably have a greater tolerance for game-changing conditions than does the UN. For example, a UN report says that Africa gets 85% of its food from off-continent. When the rest of the world is in population decline due to recent rapid fertility trends and finds that economies can't cope with sustained contraction, how is it that food production (which will face its own set of new realities/hardships this century) will somehow continue to intensify in service to Africa's population growth? It seems unlikely that Africa could pay top dollar for this service, not being a big economic/resource player. In other words, biophysical constraints outside of model extrapolations could assert in a way that hasn't been relevant in the past 100+ years. Even setting these aside, a declining population in the rest of the world will change the context within which Africa's growth has taken place, with unanticipated repercussions (seems unlikely to boost the growth, though).
Hmm, a few assumptions there.
1. Will populations in developed countries shrink, when demand for migration is growing so strongly and vastly exceeds the numbers required to make up for below-replacement fertility? Some might resist this level of immigration (gradually making them African) but the Anglosphere already has much higher immigration than needed to prevent shrinkage.
2. Who says economies can't cope with sustained contraction (and are they rational)? Usually, it's neocon economists who ignore the natural resource base and any prospect of it limiting us. It also suits the parasite classes to push this myth, as their profits depend on cheap labour and high rents. But there is every reason to believe a gradual shrinkage is very good for "the economy" if what we are measuring is wellbeing and security especially for the bottom quintile. I subscribe to Population Balance's motto: Shrink Toward Abundance!
3. As for whether Africa will be able to source its food from abroad, that's made more likely by population contraction elsewhere. But it still seems like a slim chance to me, and depends greatly on them doing more to get fertility down faster. So, when someone says, "you know what, I think world population might be about to peak much sooner than we were told" and especially if they say the economy won't cope with decline, I don't see that as being helpful toward motivating more efforts to get fertility down where it is still high. If Africa fails, I don't anticipate its miseries being contained within that continent.
I know you have to leave war out of your population calculations Tom but the two are certainly intertwined. This paper (from 2009) https://www.ncbi.nlm.nih.gov/pmc/articles/PMC2781832/ may be relevant to yours and Jane's discussion, especially regarding Africa which doesn't have any nuclear weapons to deter large scale regional wars. (The paper even presages the ukraine situation…). Demography is destiny as they say
Tomorrow's post actually does dip a toe into how war might alter projections.
Thanks for this enlightening post on the surprising trends in global TFR declines! 🌍 It's fascinating to see such a detailed analysis of the U.N. demographic projections versus the actual sharp drops in birth rates. Your breakdown of the data by country really highlights the gap between expected and actual demographic behaviors, shedding light on the potential need for models to adapt to new realities. This piece serves as a great reminder of the complexity and unpredictability of demographic shifts and the importance of keeping an open mind to emerging data. Great read! Keep up the fantastic work. 👏 denizli avukat
Thank you very much for this exploration! I am wondering whether a part of the explanation of the TFR decline might be a relative rise in the cost of living partially driven by rising ECOEs. (https://surplusenergyeconomics.wordpress.com). People in Europe often have to live longer with their parents. Even two average wages have trouble buying a house or even a flat in many places.