Watching Population Bomb

As a nod to human supremacy, any time we hear the word “population,” it generally goes without saying that we mean human population, of course. Other such words include health, lifetime, prosperity, intelligence, wisdom, murder, pro-life, culture. To many in modernity, it makes no sense to discuss the murder of an animal, the wisdom in mushrooms, or a culture among crows. Such self-centered arrogance!

But where was I? Oh my—I got derailed before even starting. This post is about population of the human sort. In the 1960s, the rate of growth of human population appeared to be on a runaway ascent, enabled by the fossil-fueled Green Revolution. This alarming phenomenon prompted Paul Ehrlich to write The Population Bomb in 1968, warning of the inherent downsides in such an uncontrolled explosion of humans. But interestingly, the word “bomb” can also describe a dramatic failure, or falling flat—as in bombing a test.

In the past, my attention to population has been limited to the following points.

  1. The growth rate is grossly unsustainable, has accelerated historically, and is a reflection of temporary fossil fuels (Section 3.1 of my textbook).
  2. Despite lower birth rates, population growth in prosperous countries constitutes the largest population-growth-related resource burden on the planet (not poor countries).
  3. The demographic transition that worked in a past age for today’s “developed” countries is not really an option for the rest in a thoroughly-exploited world. Also, the inevitable population surge and resource demand accompanying the transition is an ecological double-whammy that Earth is not obligated to (and cannot) support.

These views are still valid for me, with an asterisk on the first point that will be the focus of this post. Last week’s post included a plot of human population growth over time. I was struck by the recent phenomenon of rapidly declining growth rates, which I had noticed in tables (pre-COVID) but had never seen in visual form. Here is the relevant graph in a larger format, straight from the United Nations’ 2022 population report and associated data.
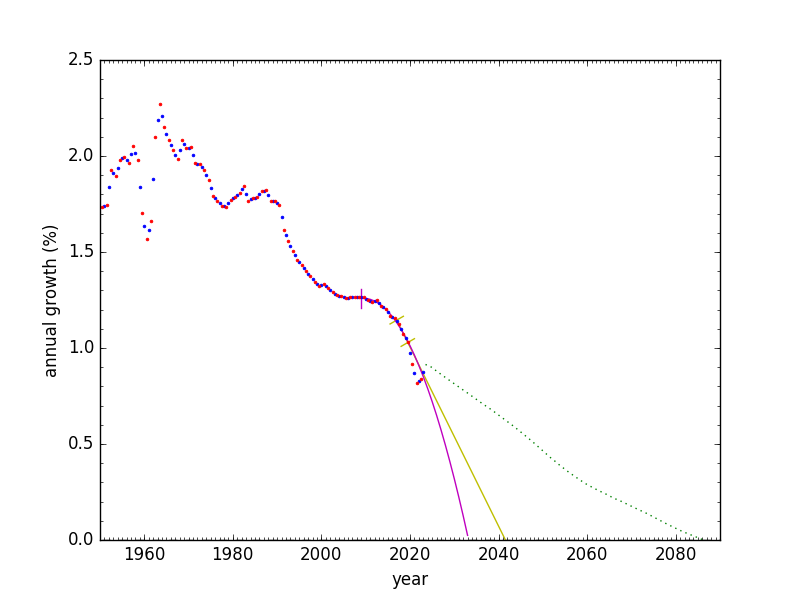
Data (dots) and projection (green-dotted line) from the United Nations. We’ll get to the solid curves later.

The annual fractional increase, in percent, is shown as blue or red dots, depending on whether tracking the July 1 to July 1 annual increase (blue, centered on the year boundary) or January 1 to January 1 (red, centered mid-year). The green dotted line is the U.N. 2022 projection for how growth rate evolves (look how it changed its mind on the slope!). When it hits zero, in 2086, the population peaks at 10.43 billion. Or their model tells us so. I’ll get to the magenta and yellow curves in due course.

The rapid decline in population rates in recent decades is impressive. The first plummet transpired from about 1988 to 2005, dropping from 1.8% per year to 1.25%. After a decade’s pause, the downward trend resumed, lately averaging 0.85% per year.

Since human population plays a huge role in the global meta-crisis, what do we make of these trends, and how might they shape our future?

Continue reading

Views: 6523

Growth or Scale?

Image by Peggy und Marco Lachmann-Anke from Pixabay

Demonstrating that growth can’t continue on a finite planet has been a favorite sport of mine in the past (e.g., here, here, and here). But it’s child’s play, really: not a difficult accomplishment. Still, as blatantly obvious as it is, a surprising number of people are surprised to hear that growth can’t last. I guess that’s what happens when an entire system is predicated on growth’s continuance. Exposing the foundation to be shaky can come as seismic news.

But let’s say that we (collectively) were able to accept that growth is a no-go for the future. Fine. Let’s just stay here, then, shall we? Maybe we fashion a steady-state economy that continues to support the present scale of the human enterprise (perhaps redistributed for better equity) but without those nasty ills of growth.

In this post, I do the simple “math” of presenting graphs (Do the Graph?) to try and ascertain whether the ills stem primarily from growth, or primarily from scale.

Death by Hockey Sticks was a simpler precursor to this post, comparing exponential-looking trends side-by-side and making the simple observation that this moment is highly anomalous, exceedingly brief, and surely can’t continue. Here, we separate growth from scale to see who deserves more of the blame.

Continue reading

Views: 2631

What's the Point?

Time for a new paint job on the house?

Having developed a perspective that modernity is fated to fail, and that many of our culture’s current pursuits and institutions are misguided efforts to prop up temporary structures, I often encounter the reaction that I am being defeatist. If what I am saying is true, then what’s the point? Yeah: what is this point that others believe justifies all the craziness? Whatever they think “the point” is could well be based on unexamined and incorrect beliefs.

I will attempt in this post to explain what I mean by this, in multiple passes. A starter example may seem a little patronizing, but could still be helpful. If your world only makes sense and has meaning on the premise that Santa Claus exists, then you’ve put yourself in an unfortunate place. Others have found ways to appreciate life without that requirement based on a falsehood.

Let’s also try generalizing the concept before getting to specific examples.  We start with something I present that happens to be essentially true (or indeed comes to pass in due time), whether or not we can say so with absolute certainty. Then imagine that the reaction is: “well, if that’s true, then what’s the point of living?” Well, we obviously are living, and if we do so in the context of this truth, then it makes little sense to say there’s no point in living. The problem must then lie in what the person believes “the point” to be, and therefore must be wrong about that. In this sense, a “what’s the point” challenge might be taken to signal a flawed worldview.

Okay. That’s the template. Let’s do a few practice cases (optional if you want to cut to the chase), and work our way toward the main event regarding modernity.

Continue reading

Views: 3983

How Far Are Stars?

Photo by Michael J. Bennett

This week’s post is a bit of a distraction from the usual business, based on a question I wondered about. Rather than ask Google, I dug in like a nerd to get a more complete picture.

One of my frequent spiels is about the vastness of space, in the context that we can dismiss fantasies about humans traveling to the stars. I do throw in an old-school calculation at the end to reinforce this point, but until then we’ll entertain ourselves with a sense for the scale of the sky we see with our eyes.

When we consider a scale model in which the sun is reduced to the size of a sand grain (about 1 millimeter), the closest neighbor star is about 30 km away. One light year at this scale is about 7 km. But how typical is this yawning gulf in our region of the galaxy? And how far away are the stars we lay eyes on in the night sky, typically?

Before getting to those questions, just how many stars can we see, naked-eye? It depends on the darkness of your sky. According to the Hipparcos catalog, rounding apparent visual magnitudes to the nearest integer, there are two −1 magnitude stars: Sirius and Canopus. Eight more join at magnitude zero; 12 at first magnitude; 71 at second; 192 at third; 622 at fourth; 1909 at fifth; and 5976 at sixth—at which point our eyes run out of steam. A suburban sky might allow fourth magnitude, or roughly 1,000 stars (not all at once, since only half are up at a time). At fifth magnitude, we get about 3,000 (all-sky). At the limit, we tally about 9,000 stars. About half this number would be above the horizon at any given time.

Incidentally, going to space hardly does a thing to improve visibility: the atmosphere is pretty impressively transparent at visible wavelengths (only “eating” about a tenth of a magnitude). I was excited to see the night sky from Mauna Kea on my first observing trip there as a graduate student. Being above 40% of the Earth’s atmosphere, it’s the closest I had been to space. The thing is, low oxygen levels impair visual sensitivity, so when I first went outside it really sucked: I could barely see a thing (eventually dark-adapted, but way slower than at lower elevations). Space is even worse on the oxygen front.

Continue reading

Views: 2009