[An updated treatment of this material appears in Chapter 1 of the Energy and Human Ambitions on a Finite Planet (free) textbook, and also appears as part of an article in Nature Physics in 2022.]
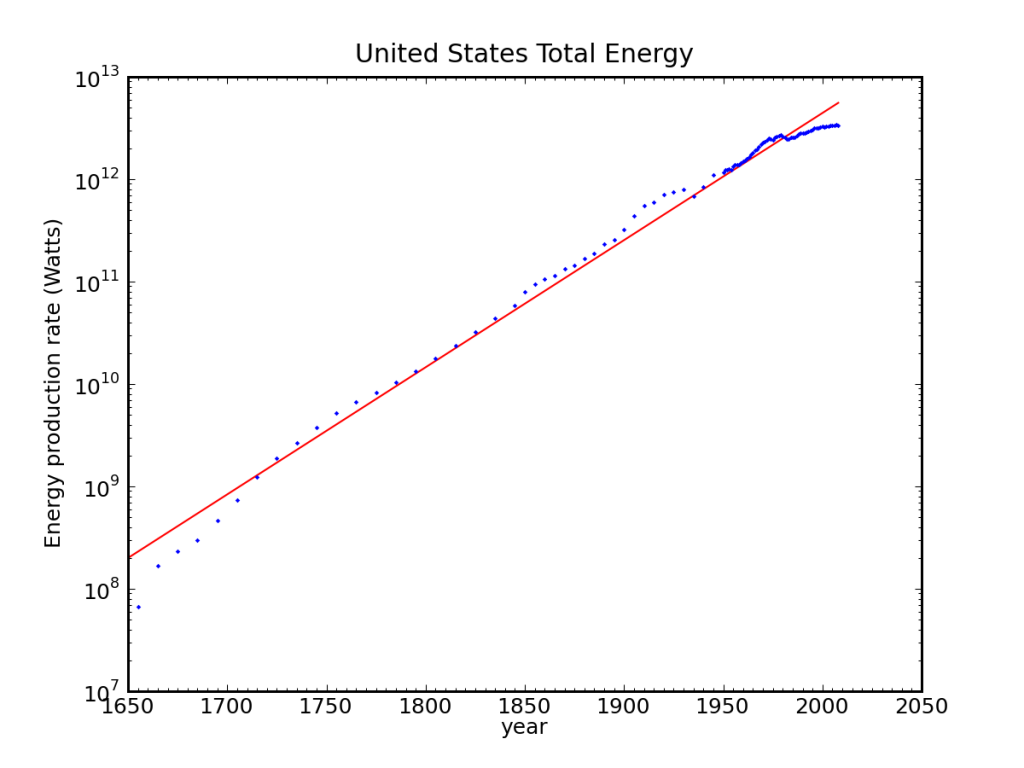
Since the beginning of the Industrial Revolution, we have seen an impressive and sustained growth in the scale of energy consumption by human civilization. Plotting data from the Energy Information Agency on U.S. energy use since 1650 (1635-1945, 1949-2009, including wood, biomass, fossil fuels, hydro, nuclear, etc.) shows a remarkably steady growth trajectory, characterized by an annual growth rate of 2.9% (see figure). It is important to understand the future trajectory of energy growth because governments and organizations everywhere make assumptions based on the expectation that the growth trend will continue as it has for centuries—and a look at the figure suggests that this is a perfectly reasonable assumption. (See this update for nuances.)

Total U.S. Energy consumption in all forms since 1650. The vertical scale is logarithmic, so that an exponential curve resulting from a constant growth rate appears as a straight line. The red line corresponds to an annual growth rate of 2.9%. Data source: EIA.
Growth has become such a mainstay of our existence that we take its continuation as a given. Growth brings many positive benefits, such as cars, television, air travel, and iGadgets. Quality of life improves, health care improves, and, aside from a proliferation of passwords to remember, life tends to become more convenient over time. Growth also brings with it a promise of the future, giving reason to invest in future development in anticipation of a return on the investment. Growth is then the basis for interest rates, loans, and the finance industry.
Because growth has been with us for “countless” generations—meaning that everyone we ever met or our grandparents ever met has experienced it—growth is central to our narrative of who we are and what we do. We therefore have a difficult time imagining a different trajectory.
This post provides a striking example of the impossibility of continued growth at current rates—even within familiar timescales. For a matter of convenience, we lower the energy growth rate from 2.9% to 2.3% per year so that we see a factor of ten increase every 100 years. We start the clock today, with a global rate of energy use of 12 terawatts (meaning that the average world citizen has a 2,000 W share of the total pie). We will begin with semi-practical assessments, and then in stages let our imaginations run wild—even then finding that we hit limits sooner than we might think. I will admit from the start that the assumptions underlying this analysis are deeply flawed. But that becomes the whole point, in the end.
A Race to the Galaxy
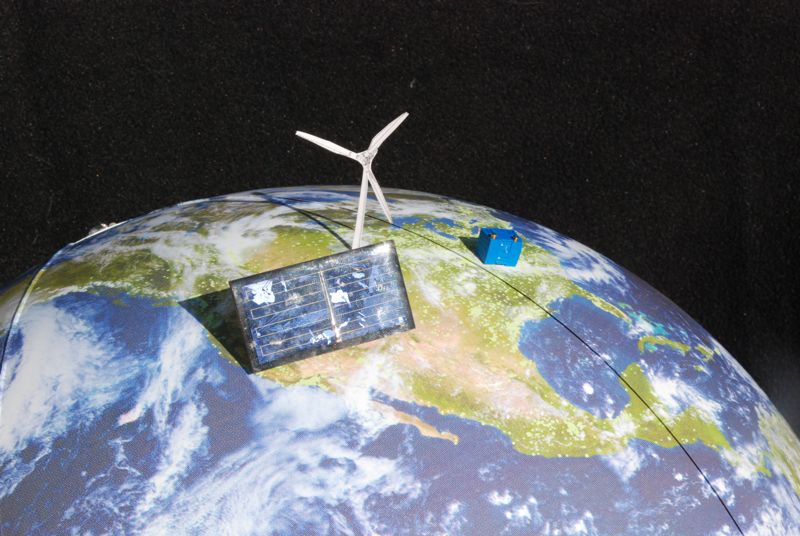
I have always been impressed by the fact that as much solar energy reaches Earth in one hour as we consume in a year. What hope such a statement brings! But let’s not get carried away—yet.
Only 70% of the incident sunlight enters the Earth’s energy budget—the rest immediately bounces off of clouds and atmosphere and land without being absorbed. Also, being land creatures, we might consider confining our solar panels to land, occupying 28% of the total globe. Finally, we note that solar photovoltaics and solar thermal plants tend to operate around 15% efficiency. Let’s assume 20% for this calculation. The net effect is about 7,000 TW, about 600 times our current use. Lots of headroom, yes? Continue reading →
Views: 69484
 So far on Do the Math, I’ve put out a lot of negative energy—whatever that means. Topics have often focused on what we can’t do, or at least on the failings or difficulties of various ambitious plans. We can’t expect indefinite growth—whether in energy, population, or even growth of the economic variety. It is not obvious how we maintain our current standard of living once fossil fuels begin their inexorable decline this century. And as I’ve argued before, achieving a steady-state future implies approximate equity among the peoples of the Earth, so that maintaining today’s global energy consumption translates to living at one-fifth the power currently enjoyed in the U.S.


