Stubborn Expectations

The major development underpinning the prospect for an early-century peak in human population and even earlier peak in civilizational power is a rapid and seemingly unexpected decline in fertility rates across the world. All regions except Africa are now below the replacement rate, and still falling.

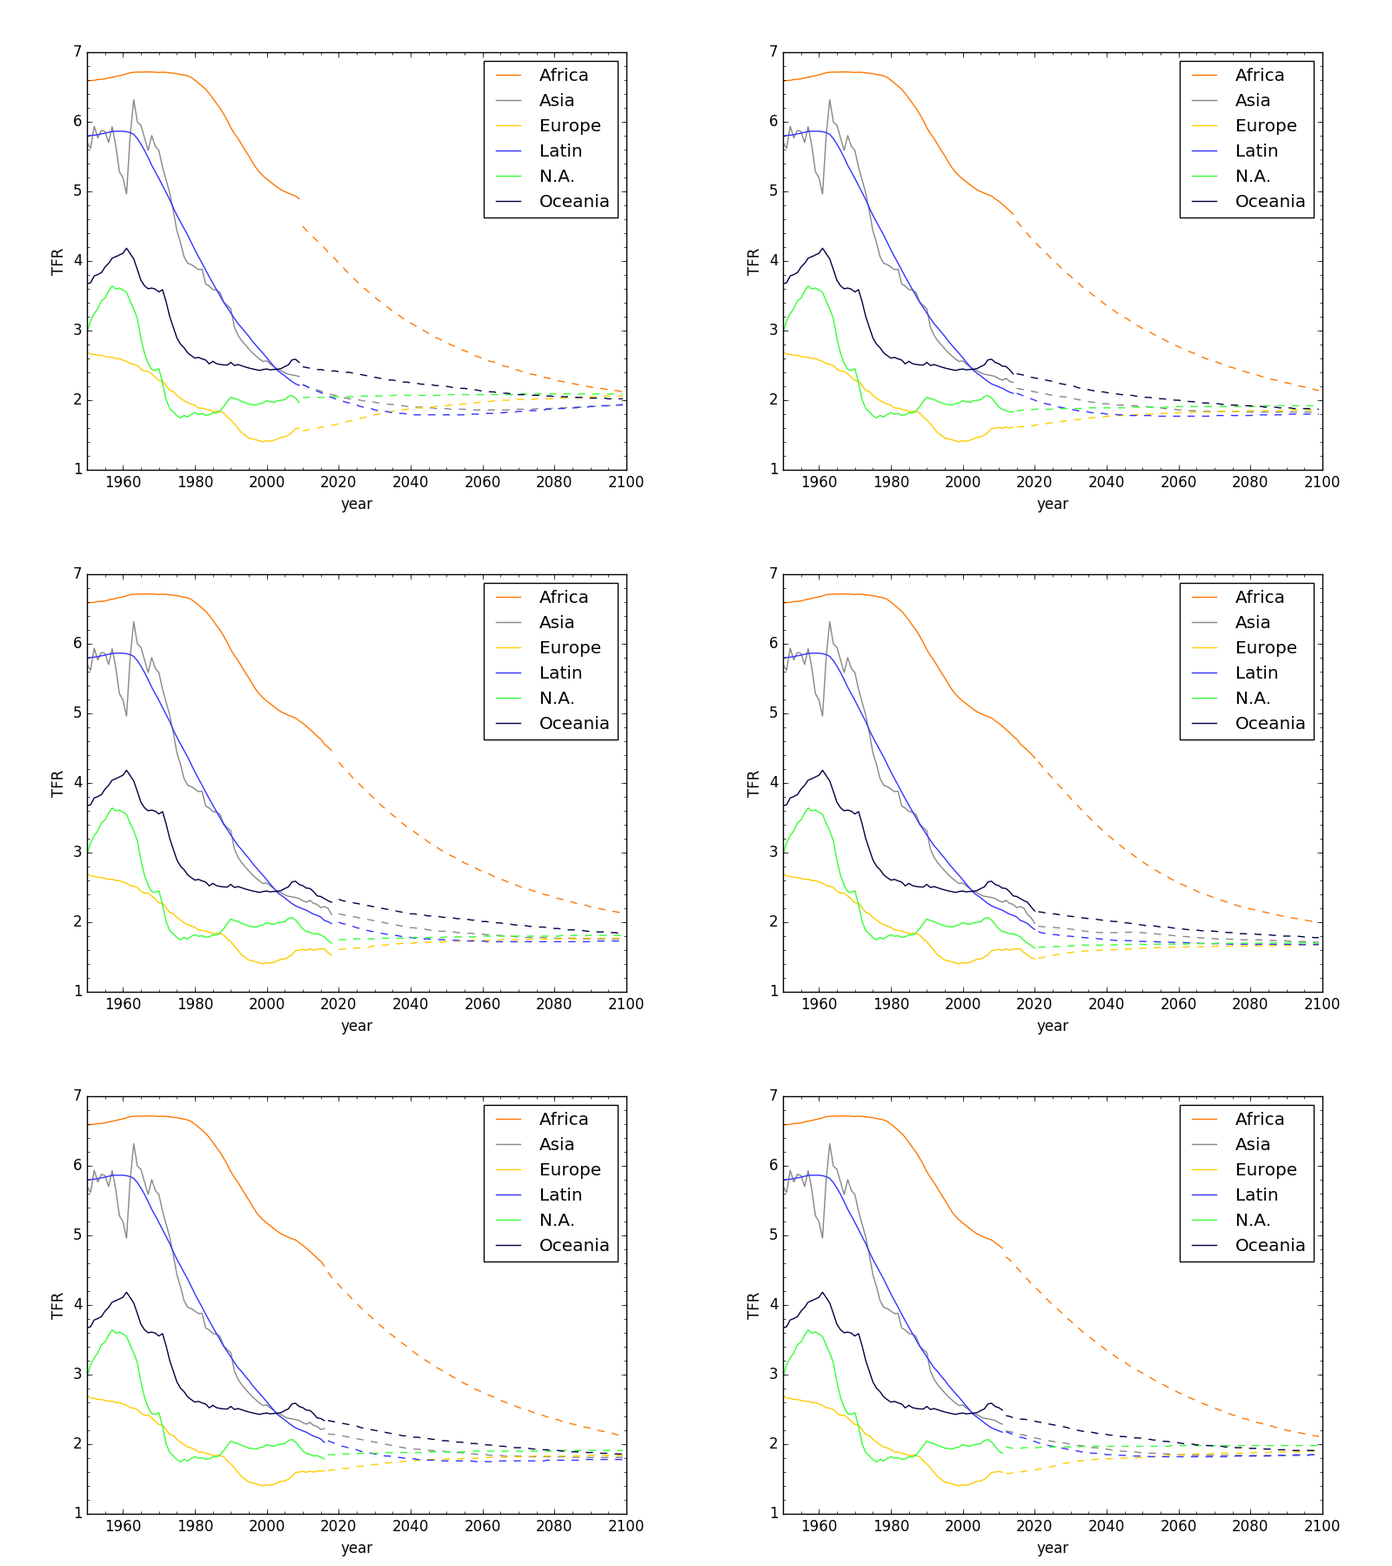
This short post—probably my last on the population topic for a while—is centered on the following animated GIF showing how the United Nations’ demographic models have expected total fertility rate (TFR) to evolve into the latter part of this century.

U.N. TFR projections from 2010, 2012, 2015, 2017, 2019, and 2022.

Every few years, the U.N. releases a demographic projection model that includes an expectation of how TFR will behave going forward.  I have already pointed out the glaring discontinuity (kink) at 2020 in the latest projection and a gallery of systematic major misses at the country level.  What the animated GIF above helps us see is how stubborn the imagined far future is—consistently aiming for a one-size-fits-all convergence.

I have referred to the notional TFR endpoint as a “magnet,” acting like a theoretical convergence point to which all regions are attracted.  We see how persistently influential this magnet is on projections in the sequence above.

Continue reading

Views: 2724

Peak Power Video

I’m on a video kick lately, finding that it’s a good way to capture key points and reach people who never would have stumbled onto Do the Math. Here is a video to accompany the latest post on peak power.

I also added a playlist to my YouTube channel that has other appearances I’ve done (podcasts and the like). While I was at it (as I learn this space), I added chapters to my channel videos to make it easier to find key content. Enjoy! I think I’m also supposed to say: please like and subscribe—but I don’t know if I’m doing this right, yet.

Views: 575

Brace for Peak Impact

Image by Paul Brennan from Pixabay

Guilty as charged: my recent postings have been all about human population and when it might peak. I don’t mean to be a bore, but it’s an important topic connected to planetary limits, human impacts, ecological health, and the appealing prospect that a near-term peak may offer an earlier off-ramp for modernity. In the past, I have stressed the point (in a blog post from 2013 and later in a textbook chapter) that population per se isn’t the phenomenon of greatest concern, but its multiplication by resource usage. It’s the combination that launches us over the ecological cliff edge, commonly expressed by the I=PAT formula for impact on the planet.

In this post, I belatedly take my own advice and re-frame the population investigation in resource terms. Now that I have a demographic tool, I can ask questions relating to when we might hit peak power as a civilization. I use power (rate of energy use) as a proxy for all manner of resource dependencies, as energy usage correlates strongly with materials use and ecological impact. Plus, it is a readily-available measure.

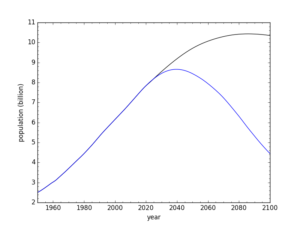
So, given various assumptions about how fertility rates evolve regionally, and factoring in different models for regional survival rates and migration, when might we expect global resource use to peak and begin a decline? In tandem with this event, we might correspondingly expect peak industrial output, and peak rate of (accumulating) damage to ecological health—which includes our own health. In the U.N.’s standard demographic model, population does not peak until 2086 at 10.4 billion—largely bolstered by population growth in Africa, which the U.N. parameters indicate will climb to 4 billion by 2130 (we’ll see…). But, since Africa is by far the region with the lowest per-capita consumption, declines elsewhere could more than offset Africa’s population increases in terms of resource burden.

Enough speculation: let’s unleash the model and see what happens.

Continue reading

Views: 5133

Peak Population Video

I put together a short (13.5 minute) video to synthesize the main points from my exploration into demographic models and what it could mean in terms of an early peak. If you’ve read the first three posts in the population series (bomb, projections, whiff), then this offers nothing new. In any case, perhaps it is an efficient way to introduce or revisit the content.

Views: 764

Population "What If" Games

Image by StockSnap from Pixabay

Readers may have noticed that I’m on a bit of a demography kick of late, and this post is no different.  Several reasons contribute to this focus.  First, human population is an extremely important factor in the future health of this planet.  Second, I am fascinated by the prospect that population growth may not turn out to be as crushing as I had previously believed.  Third, having developed a tool for demographic projection, I want to get my money’s worth before scooting off to something else.

The first post in this series examined the unexpected realization (on my part) that current trends could put us on track for a global population peak in the next few decades—maybe deflating the population balloon before something pops. In the process of investigating how this squared with most projections that show a late-century peak, I came to understand the theoretical biases—especially in fertility—employed by United Nations demographers. This first post also explored possible implications of an early peak: how modernity would cope with such a major, unprecedented, and rather prolonged period of declining population. The second post sketched out a reasonably sophisticated demographic propagation tool I constructed tracking six regions of the world so that I might reproduce the U.N. projections and explore what I considered to be plausible variants in terms of both fertility evolution and survival/medical trends.  I also wedged in a bonus post exposing the repeated systematic failure of demographic projections to capture recent rapid trends in declining birth rates.  The models apparently don’t incorporate whatever drives this major phenomenon.

In this post, I examine a few implausible scenarios for the purpose of isolating and better understanding factors at play. I think of it as answering “What If” questions (calling to mind Randall Munroe’s excellent What If series of outlandish yet illuminating questions). What if fertility around the globe suddenly locked at the replacement value? What if things stayed exactly as they are today? How much earlier would population peak if Africa’s fertility fell as rapidly as other recent precedents? What if we suffered a pandemic or global resource war?

The first few of these explorations are not intended to be realistic as much as they are illustrative of the relative importance of various factors. I learned from the exercises, at least, and hope you will, too.

Continue reading

Views: 1920

Whiff After Whiff

Image by Anne and Saturnino Miranda from Pixabay

The word “whiff” is used in baseball to describe when the batter swings and makes no contact with the pitched ball. The term presumably derives from the sound of hitting nothing but air.

This off-sequence post acts as a brief update that I wanted to present, without making a full-fledged blog post out of it (in hindsight, I may have failed). In the last two posts (here and here), I noted that recent rapid drops in child birth around the world could conceivably put us on track for an earlier population peak than previously anticipated—possibly as early as 2040 vs. the 2080–2090 timeframe.

That would be big news, and makes me continually ask myself: where is the disconnect? Is it possible that demography models are that wrong? I have discussed already (and will revisit in the next post) some of the potential blind spots for how this century develops. But here I look backwards to see if the recent drop in child births was itself a surprise to the demographers. If so, then it speaks to dynamics at play not captured in demography models, and that’s important.

I used the 2022 United Nations World Population Prospects (WPP) data (public) to build a list of countries that had the largest fractional declines in total fertility rate (TFR) from 2010 to 2019 (pre-COVID), and that also had projections in previous U.N. WPP products back to 2010. I show how (not) well the U.N. expectations match the actual story for these cases. I also throw in a few other countries of interest, including the three most populous ones.

Continue reading

Views: 2010

Peak Population Projections

Last week, I reported the surprising realization that official population projections from the United Nations adhere to a notion of future fertility that appears to be immediately at odds with present real trends. The recent rapid decline in population growth—even pre-COVID—suggests that a population peak prior to 2050 is not outlandish, provided that current drivers continue to apply.  Recent declines in fertility rates, together with a flattening age distribution of young folks, combine to set the stage for population peak and decline.

In the previous post, I performed two embarrassingly crude projections of recent trends (simple curve fits) to demonstrate that a population peak as soon as 2042 or even 2033 should not be ruled out, and in fact seems to be where we’re heading if present trends continue.

I mentioned that I was working on tooling up a more sophisticated model to do some exploration of my own. The goal was to track the nuances of actual age distributions across the world, together with alternative ideations of fertility evolution (greater weight on what is actually happening lately), and allowance for non-monotonic evolution of medical care and life expectancy going forward. It was a daunting task, but I was consumed with curiosity and powered through the exercise over a few intense days.

In this post, I will give an overview of what goes into my demographic projection model, why I believe it works well enough to be useful, and what top-level questions we can explore using it.

Continue reading

Views: 11686

Finite Feeding Frenzy

Image by ariesjay castillo from Pixabay

You may be aware that our food industry is heavily dependent on fossil fuels, to the point that it takes about 10 kcal of energy input to deliver 1 kcal of consumed food. The enormous energy multiplier is due to extensively mechanized plowing, harvesting, processing, and delivery of food; fossil-fueled fertilization (via methane feedstock); refrigeration and preparation; then of course food waste. In olden times, when all agricultural energy came from muscle power that needed to be fed, the system would collapse (i.e., starve and fail) if energy inputs exceeded energy ingested.

Some have phrased our current practice as “eating fossil fuels,” and in fact a 2006 book by Dale Allen Pfeiffer had this title. So what? More power to us—literally.

The problem, people, is that fossil fuels are finite. We have already consumed a fair fraction (roughly half?) of the accessible allotment. And before concluding that we therefore have a century or so before needing to worry about the consequences, realize that the inflection point happens around the halfway mark, wherein decreasing ease of access tends to result in ever-decreasing output rates in the second-half of the resource. We see this behavior in individual oil fields and in regional (country-scale) aggregations. The low-hanging fruit is taken first, sensibly, so that what’s left is more stubborn.

Because human population has been substantially boosted by fossil fuel input, we have put ourselves into a vulnerable position. What happens when fossil fuels begin to give out on us?

It’s been a while since I did any, you know, math for this blog, as I seem to be living my own worst nightmare and turning into an armchair philosopher (oh the shame). In this post, I return to something closer to math. It’s illustrative rather than quantitative, but helps frame the peril we have put ourselves into in a low-effort sort of way.

Continue reading

Views: 8546

Tuning in on Noise?

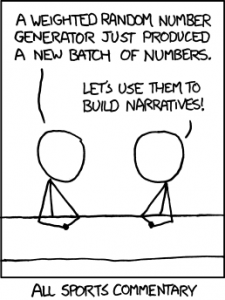
xkcd-904It’s a bit off-topic for the series, but I can’t even go to Google now without being reminded of the World Cup and soccer this, soccer that. (Apologies to non-Americans who know the sport as football—but don’t get me started on football!) I have often wondered: given characteristic low score values, is soccer anything more than Poisson noise? When discussing this with colleagues, one pointed me to this XKCD comic, reproduced at right.

Any random process that produces discrete events in some time interval, with uniform probability per unit time follows a Poisson distribution. When the number of events becomes large, the distribution tends toward a Gaussian (normal) distribution.

My thesis is that soccer is an amalgam of random processes whose net effect produces rare events—those more-or-less unpredictable events spread more-or-less uniformly in time. Whether a good or bad bounce off the bar, a goal keeper who may or may not prevent a goal, a referee who may or may not see an illegal action, a pass that may or may not be intercepted, and on and on: the game is full of random, unpredictable events. So I expect soccer to behave similarly to a Poisson process and follow a Poisson distribution. By extension, I will claim that the attention devoted to the World Cup is founded on flimsy numerology and might even be called a tremendous waste of time and money.

Normally I allow comments on Do the Math for ten days after each post. I’ve tackled some controversial topics and stirred up emotional responses. Yet I predict that the outrage generated by my insinuation that watching soccer is a waste of time will absolutely dwarf the reactions to my saying that we may not be looking at a space-faring future, or that indeed we may face collapse of civilization. To the extent that this (untested) prediction is true, it would seem that soccer is more important than the fate of the world, in the eyes of many. Scary, if true. [After reconsideration, I enabled comments, but I won’t have time to vet and respond with my usual level of attention.]

But getting back to soccer numerology, my question becomes: given a final score (which is taken to be the ultimate “truth” of the match) how likely is it that the victor is actually a better team?

Continue reading

Views: 2431

The Energy Trap

[This topic also appears in Chapter 18 of the Energy and Human Ambitions on a Finite Planet (free) textbook.]

Many Do the Math posts have touched on the inevitable cessation of growth and on the challenge we will face in developing a replacement energy infrastructure once our fossil fuel inheritance is spent. The focus has been on long-term physical constraints, and not on the messy details of our response in the short-term. But our reaction to a diminishing flow of fossil fuel energy in the short-term will determine whether we transition to a sustainable but technological existence or allow ourselves to collapse. One stumbling block in particular has me worried. I call it The Energy Trap.

In brief, the idea is that once we enter a decline phase in fossil fuel availability—first in petroleum—our growth-based economic system will struggle to cope with a contraction of its very lifeblood. Fuel prices will skyrocket, some individuals and exporting nations will react by hoarding, and energy scarcity will quickly become the new norm. The invisible hand of the market will slap us silly demanding a new energy infrastructure based on non-fossil solutions. But here’s the rub. The construction of that shiny new infrastructure requires not just money, but…energy. And that’s the very commodity in short supply. Will we really be willing to sacrifice additional energy in the short term—effectively steepening the decline—for a long-term energy plan? It’s a trap!

Continue reading

Views: 31499